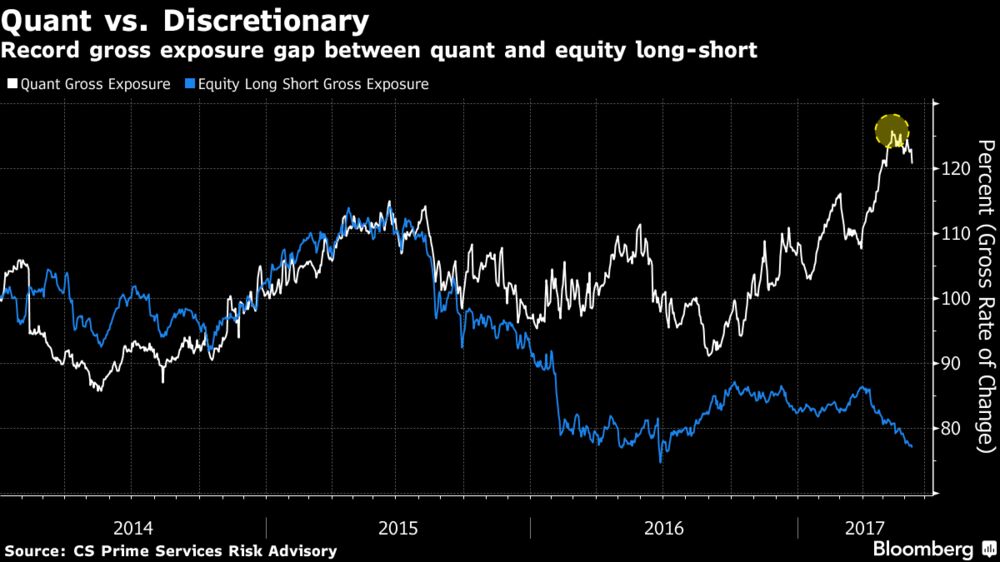
Widening gap between quants, fundamental long-short managers
Systematic strategies now fastest growing investment category
That money you see sloshing around in the U.S. stock market? It belongs to the robots.
At
least, that’s the picture emerging from a growing divergence between
quantitative funds and discretionary managers. Systematic strategies
have barely budged from near-record participation in U.S. stocks.
Meanwhile, fundamental equity long-short managers can’t afford to be
anything but picky, considering the market’s narrow leadership.
The
result: the largest gap on record between humans’ and computers’ gross
exposure to U.S. equities, data compiled by Credit Suisse Group AG show.
For now, systematic traders are the dominating force in markets.
“This is the largest footprint for quants. It’s a function of
allocation and leverage,” Mark Connors, global head of risk advisory at
Credit Suisse Group, said. “The reason why that’s important is that
they’re not going away. Complexity isn’t going to be rolled back.”
In
a sense, the divergence reflects the growing popularity of quant
methods over traditional strategies. Nailing down the exact size of the
quantitative space is nearly impossible, though some estimates are as
high as $500 billion. What’s more certain is that it’s getting bigger.
Quant is the fastest growing category on both Credit Suisse’s prime
brokerage platform and the broader universe.
Passive and
quantitative investors now account for about 60 percent of all equity
assets, compared with 30 percent a decade ago, according to data from JP
Morgan Chase & Co. The firm estimates that only 10 percent of
trading volume now comes from discretionary investors.
But determining whether this computer-driven force dictates
market moves is another matter. Quants on the Credit Suisse platform are
roughly defined as funds that invest in thousands of equities and trade
dynamics, rather than making stock-specific bets. Since they use
different signals and time horizons, their combined impact is likely
muted.
Finger Pointing
“Diversity of market participant
trading is a very important element of a healthy market. Quant funds
certainly add to that diversity, and I feel that is very good,” said
Jaffray Woodriff, co-founder and chief executive officer of Quantitative
Investment Management, which oversees $3.5 billion. “Funds that are
completely uncorrelated to everybody else and that also trade a lot of
volume are very good for the liquidity of the investment ecosystem.”
That hasn’t stopped some from pointing fingers.
Through Monday, the Nasdaq 100 Index had its worst two-day slide in nine months. Yet the strongest indicator
of whether a stock in the gauge tumbled was not its industry, but
momentum -- or the strength of a share’s gains over the past year. That
kind of proportionality is the hallmark of a systematic strategy that
unwound momentum positions, said Andrew Lapthorne, global head of
quantitative strategy at the bank.
Regardless of quantitative
investors’ behavior, fundamental managers are ceding whatever control
they have left. Gross exposure to U.S. stocks among equity long-short
funds, the largest category of discretionary investing, has dwindled in
2017 to near a record low. The closing out of short positions that
burned managers is partially to blame for that, according to Connors.
Increasing Leverage
Over
the past three months, the most shorted equities have outperformed
hedge fund favorites by nearly 7 percentage points, according to baskets
compiled by Goldman Sachs Group Inc. Meanwhile, narrow leadership has
made it difficult to hold bullish positions on a variety of industries.
“You
can’t get bigger if half of your book isn’t performing,” Connors said.
“They’ve had to be long tech because that’s all that’s worked.”
Then,
there are the quants, who hit the highest gross exposure to equities on
record around May 12, data from Credit Suisse show. It’s since come
down slightly, but still remains elevated. As volatility in the stock
market stays low, returns among quantitative strategies have been
compressed, likely compelling managers to increase their leverage to
juice up returns, Connors said.
Steady Exposure
Likewise, Quantitative Investment Management’s
Tactical Aggressive Fund, a $1.2 billion equity fund, has higher than
average gross exposure, according to Woodriff, who cited the low
volatility and high dispersion environment. That’s paid off, as his fund
rose 13 percent in May to round out a 55 percent gain for the first
five months of the year, according to an investor document seen by
Bloomberg News.
Even so, quants’ exposure tends to be more steady
than fundamental managers, said Maria Vassalou, head of Perella Weinberg
Partners LP’s Global Macro Fund.
“Discretionary managers come and
go, and can affect the volatility of the market more. When they take
risks, they sometimes bet the farm,” Vassalou said. “Quants focus on a
lot of assets that make up their portfolio. They’re less likely to be
impactful overall for any particular stock.”https://www.bloomberg.com/news/articles/2017-06-15/it-s-a-quant-s-stock-market-as-computer-programs-keep-on-buying
Henry Blodget dives deep into two charts from John Hussman.
Based on many different market valuation measures, stocks are extremely
expensive. Blodget does point out that stocks can always get more
expensive in the short term. However, the expected long-term return on a
portfolio of stocks, bonds, and cash is very low based on these
valuation levels.
An interview with legendary investor Jim Rogers. Rogers predicts a
market crash in the next few years. One that he says will rival anything
he has seen in his lifetime. He also goes after the Fed. Rogers says
the Fed is clueless and is setting the US up for disaster. Rogers likes
investing in depressed markets. Rogers says its just like your parents
taught you... "Buy low and sell high. Don't buy high and hope it goes
higher." He is investing in China, Russia, Japan and agriculture. All
these markets are depressed. Unlike the US which is at an all-time high.
Though Rogers says the most important thing is to invest in what you
know.
Billionaire investor Ron Baron thinks Tesla shares have a lot of room to run.
Speaking on CNBC's "Squawk Box"
Tuesday morning, the founder of Baron Capital said, "I think it is
going to be about $500 to $600 next year, and I think it is going to be
$1,000 in 2020."
At that time, Baron said, he expects
the company to have $70 billion in revenue and to be earning $10 billion
in operating profits. By 2020, the company expects to be selling 1
million cars per year.
Baron is a major Tesla
shareholder. He said he bought about 1.6 million shares about 3½ years
ago, at an average share price around $208 to $210.
Baron said he does not think
other car companies can catch up to Tesla's electric vehicle technology.
But tech firms, some with deep pockets, are also moving in. Tech giant
Appleconfirmed it is working on autonomous driving on Tuesday, making it another of the several firms that have publicly discussed such plans.
NEW YORK (CNNfn) - U.S. stocks soared Tuesday, with the broad Standard & Poor's 500 index setting its first record high of the year, as investors, relieved that the Federal Reserve's latest interest-rate hike is over, poured money into stocks, betting that strong first-quarter corporate profits lie ahead. "It's a relief rally," said Charles Lemonides, chief investment officer at M&R Capital. Typically, steeper borrowing costs hurt stocks by eating into company earnings. But analysts said stock prices already reflected the Fed's well-telegraphed move, aimed at keeping the white-hot economy from generating inflation. And investors Tuesday found a lot to like in General Electric after one of the nation's largest and most diverse companies said its profit would beat Wall Street expectations. "It was a precursor to a great earnings season," Michael Holland, chairman of Holland & Co., told CNN's Street Sweep. "I think the next few weeks are going to be better than anyone expects." Steeper rates like the kind the Fed delivered generally mean higher bond yields, drawing equity investors into fixed-income securities. But the yield on the 30-year Treasury bond edged lower after the report, giving stock investors one more reason to buy. And buy they did. The Dow Jones industrials jumped 227.10 points, or 2 percent to 10,907.34.� The Nasdaq composite index, home to many technology firms, was down before the Fed news. But the gauge surged 101.68, or 2.2 percent, to 4,711.68. "The theory is that with rate increases, it doesn't effect the 'new economy' stocks," said Ken Sheinberg, head of listed trading SG Cowen. The broader S&P 500 rose 37.24, or 2.5 percent, to 1,493.87, a record. Still, stock market breadth was mixed. Advancers on the New York Stock Exchange outpaced decliners 1,798 to 1,157. Trading volume topped 1 billion shares. But Nasdaq losers beat winners 2,510 to 1,767. More than 1.7 billion shares changed hands. In currency markets, the dollar rose against the yen and euro.
More hikes expected
The action, which brings the federal funds rate to its highest point in nearly 5 years, gets one rate hike out of the way. But focus immediately shifted to early May, the Fed's next meeting, when many expect another rate hike. Bill Meehan, senior market analyst at Cantor Fitzgerald & Co., said the Fed's statement accompanying the move indicates at least one more rate hike in May. "What the Fed had to say may have been a little more bearish to the folks who thought this was would be the last rate hike," Meehan said. The move also allowed the market to focus on corporate profits for the first three months of the year, which companies begin reporting next month. The Dow's financial components, typically sensitive to higher rates, led the blue-chip index higher. American Express (AXP: Research, Estimates) jumped 3-7/8 to 145-7/8, J.P. Morgan (JPM: Research, Estimates) surged 5-9/16 to 129, and Citigroup (C: Research, Estimates) gained 1-7/8 to 58-1/16.� The gains came after the second investment bank in two days posted higher-than-expected profits. Goldman Sachs (GS: Research, Estimates) earned $1.76 a diluted share for the latest quarter, above Wall Street forecasts of $1.48 a share and the $1.12 a share the investment house earned a year earlier. Lehman Brothers (LEH: ResearchEstimates), another big financial firm, Monday reported quarterly income of $541 million, or $3.69 a diluted share, strongly topping forecasts and nearly double year-earlier figures. Goldman rose 4-13/16 to 118-1/4 and Lehman gained 1-15/16 to 89-3/4. Another Dow component, General Electric (GE: Research, Estimates), rose 10-5/16 to 151-1/4 after the conglomerate said it sees its first-quarter profit outpacing Wall Street estimates, driven by growth in order rates and healthy operations around the world. Also lifting the Dow, Philip Morris (MO: Research, Estimates) jumped 1/2 to 20-7/16. The gain came as the Supreme Court, in a 5-4 decision, ruled that the Food and Drug Administration has no authority to regulate tobacco as an addictive drug. Some of the Nasdaq performers, down earlier in the session, turned around later. Oracle (ORCL: Research, Estimates) surged 2-9/16 to 80-11/16. JDS Uniphase (JDSU: Research, Estimates) jumped 5-5/8 to 127. Alan Skrainka, chief market strategist for Edward Jones, told CNNfn's Market Coverage that while the recent blue-chip rally may not have ended this year's correction, he thinks "old economy" stocks are a better investment than their "new economy" counterparts. (413K WAV or 413K AIFF). But 3Com Corp. (COMS: Research, Estimates), up more than 68 percent in the last three months, fell 4-15/32 to 64-3/32 after reporting better-than-expected quarterly results and announcing a reorganization plan late Monday. The computer network provider reported earnings outside of investment gains of $94 million, or 27 cents a diluted share, 2 cents above expectations. The company also said it was exiting its analog modem and local area network businesses, which will result in 1,000 job cuts. Interstate Bakeries (IBC: Research, Estimates) fell 7/16 to 14-3/8. A Teamsters strike against the baking company is creating shortages of Wonder Bread, Twinkies and other products across parts of the Northeast.
Trade balance widens
In economic indicators, January's U.S. trade deficit widened to a record $28 billion, the Commerce Department said, well above economists' estimates of a $26.5 billion gap. The data, which show American consumers continue to spend on imports, had no apparent market effect. Still, American consumers fuel two-thirds of the economy. And first-quarter gross domestic product already was expected to rise at a pace that Fed officials believe may generate inflation. So the data could give Fed officials one more reason to tighten credit in the months ahead. But if Tuesday is any indication, the market won't care
NEW YORK (CNNfn) - The Nasdaq composite index closed above 5,000 for the first time Thursday as investors poured money into chipmakers, wireless providers and Internet firms. In the tug-of-war contest going on between old-economy stocks and new-economy stocks -- it was the new-economy issues that carried the day Thursday, allowing investors to forget all about the Dow's 374-point drop on Tuesday. Thanks to a boost from two key technology components, the blue-chip index rallied to close above the key 10,000 mark. But the gauge -- born in the 19th century and home to many industrial firms, financial companies and drug makers -- is still down 13 percent this year. In the same period, the Nasdaq is up a stunning 24 percent, reflecting a growing belief on Wall Street that technology stocks will continue to rise even if the Federal Reserve hikes interest rates. "It's amazing to see intellectual capital turn into profits so quickly." Phil Dow, stock market strategist at Dain Rauscher Wessels, told CNN's Street Sweep. Quickly, indeed. The Nasdaq, which doubled in little more than a year, first crossed the 4,000 mark just over two months ago. On Thursday, the Nasdaq rose 149.60 points, or 3 percent, to 5,046.83 -- the fifth biggest point gain in its 29-year history. The Dow, meanwhile, jumped 154.20 points, or 1.6 percent, to 10,010.73, recovering from a 117-point slide earlier in the session. But the gains are misleading. Hewlett-Packard and Microsoft -both so-called� "new economy" stocks --combined for 77 Dow points. The S&P 500, meanwhile, rose 34.99 points, or 2.6 percent, to 1,401.69. The Russell 2000 index of smaller companies, one of the year's best performing market gauges, rose to its 14th record of the year, gaining 11.37 points, or 2 percent, to 606.05. More stocks rose than fell. Advancing issues on the New York Stock Exchange led decliners 1,691 to 1,273. Trading volume topped 1.2 billion shares. Nasdaq winners beat losers 2,476 to 1,826. More than 1.9 billion shares changed hands. In other markets, Treasury securities rose. The dollar fell against the yen and was little changed vs. the euro.
The road to a milestone
While the Nasdaq's surge is about the growth prospects of its members, it owes some of its performance to momentum. "When you break through 5,000 everyone wants to be in the game and everyone want to be in the growing technology space," Brian Finnerty," head of Nasdaq stock trading at C.E. Unterberg Towbin Art Hogan, senior chief market strategist at Jefferies & Co. agreed. "Fifty-two percent of the households in America are invested in the U.S. stock market and they want to invest in the things that had 70 percent growth last year," Hogan said. "As long as the money keeps flowing into equity mutual funds and they are targeted toward Nasdaq stocks, we are going to see this go on for a while." The usual suspects led the gains. Dell �(DELL: Research, Estimates) rose 3-1/5 to 50-7/16, Microsoft �(MSFT: Research, Estimates) jumped 4-7/16 to 100, Cisco Systems �(CSCO: Research, Estimates) climbed 6-15/16 and Intel (INTC: Research, Estimates) gained 3-7/16 to 118-3/8. A $1,000 investment in Cisco five years ago would be worth $31,000 today.
The battered Dow
With investors chasing high-growth companies they believe will grow despite higher interest rates, money has fled blue chips whose profits are seen as more sensitive to tighter credit. The trend let up slightly Thursday. Still, one third of the Dow's stocks fell, with International Paper �(IP: Research, Estimates) losing 1-9/32 to 34-3/4, Eastman Kodak �(EK: Research, Estimates) shedding 1-1/2 to 54-15/16, and 3M (MMM: Research, Estimates). Harvey Hirschhorn, executive vice president at Stein Roe Farnham, told CNNfn's market coverage that he sees this Nasdaq/Dow divergence continuing. (531K WAV) (531K AIFF). "People ask and say why should I pay 30 times (earnings) for something that may grow at only 10 or 15 percent," Jim Glickenhaus, portfolio manager at Glickenhaus & Co., told CNNfn's talking stocks. "The question is: Is it as exciting as something like Texas Instruments that I believe is going to grow at 25 percent or 30 percent for the next 10 years?" The Dow fell 374 points Tuesday after Procter & Gamble, one of the nation's most dependable blue-chip performers, rattled Wall Street with an earnings warning. Cautiousness continued Thursday, with Procter & Gamble (PG: Research, Estimates) falling 1/16 to 57-15/16. "The P&G story is a lot more significant than just its relationship to P&G," said Barry Hyman, chief market strategist at Ehrenkrantz King & Nussbaum.
The Fed ahead
In economic indicators, the number of Americans filing for first-time jobless claims rose to 280,000 for the week ended Mar. 4 from 275,000 the week before, the Department of Labor said. The figure, though higher, is consistent with the tight labor markets that have existed the past few years. Separately, wholesale inventories rose 0.7 percent in January, the government said. That's higher than the 0.4 percent gain expected by analysts surveyed by Briefing.com. The latest batch of strong data may give Federal Reserve inflation fighters one more reason to raise interest rates later this month. The central bank tightened credit four times since June, bringing its main lending rate to 5.75 percent. Stock investors fret that higher rates will hurt corporate profits by raising borrowing costs. Fed Chairman Alan Greenspan has warned that rising stock prices are fueling a surge in consumer spending that must be quelled with higher interest rates. But these threats create a problem for the world's most powerful banker. Higher rates have hurt most of the stock market but have not stopped money from pouring into technology stocks. Consider this: If the Nasdaq doubles again in the next 12 months and the Dow continues to stagnate, the Nasdaq will overtake the blue-chip index in value.
One month ago, when observing the record low vol coupled with record high stock prices, we reported a stunning statistic: central banks have bought $1 trillion of financial assets just
in the first four months of 2017, which amounts to $3.6 trillion
annualized, "the largest CB buying on record" according to Bank of
America. Today BofA's Michael Hartnett provides an update on this
number: he writes that central bank balance sheets have now grown to a
record $15.1 trillion, up from $14.6 trillion in late April, and says
that "central banks have bought a record $1.5 trillion in assets YTD."
The latest data means that contrary to previous
calculations, central banks are now injecting a record $300 billion in
liquidity per month, above the $200 billion which Deutsche Bank recently warned is a "red-line" indicator for risk assets.
This, as we said last month, is why "nothing else matters" in a market addicted to what is now record central bank generosity.
What
is ironic is that this unprecedented central bank buying spree comes as
a time when the global economy is supposedly in a "coordinated
recovery" and when the Fed, and more recently, the ECB and BOJ have been
warning about tighter monetary conditions, raising rates and tapering
QE.
To this, Hartnett responds that "Fed hikes next week & "rhetorical tightening" by ECB & BoJ beginning, but we fear too late to prevent Icarus" by which he means that no matter what central banks do, a final blow-off top in the stock market is imminent.
He is probably correct, especially when looking at the "big
5" tech stocks, whose performance has an uncanny correlation with the
size of the consolidated central bank balance sheet.
Just like the Dutch Tulip Bulb bubble, internet stock bubble, and
the mid-2000’s financial asset bubble, the current stock market is no
longer a price-discovery mechanism. It has deteriorated into a venue
in which Central Bank-manufctured liquidity – in the form of printed
currency and credit creation – has flooded into the system, enabling
investors to chase the few stocks rising in price at the highest
velocity (click to enlarge, graph on the left sourced from Jesse’s Cafe Americain).
The drivers of this modern day Dutch Tulip phenomenon are the
so-called “Five Horsemen” stocks – AAPL, AMZN, FB, GOOG,MSFT. To that
grouping I toss in TSLA. Among all of those bubble stocks, TSLA has
become, by far, the most disconnected from any remote intrinsic,
fundamental value. AAPL alone is responsible for 25% of the YTD gain in
the Dow and 13% of the YTD gain in the S&P 500. AAPL’s revenues and
operating income have declined over the last three years (2014
to 2016). More often than not, even on days when the S&P/Dow are
red, most if not all of the Five Horsemen + TSLA seem to close green.
Eventually, the music will stop and this
“no-price-discovery-possible” market will become a “can’t find a seat”
market. The abruptness and rate of decline will be breathtaking.
Perhaps only matched by the outflow of capital from the cryptos by
“investors” who leveraged up their cryptocurrency holdings to throw more
“money” at TSLA.
The good news is that a lot of money can be made shorting stocks.
Since April, stocks like IBM, GS, SHLD, BZH and GE presented in the
Short Seller’s Journal as shorts have outperformed the SPX/Dow. SHLD is
down 47% in 7 weeks – a home run. BZH is down 18% in three weeks. In
the next issue, a “funky” financial stock will be featured that has the
potential to drop at least 50% over the next 12 months if not sooner.
No one knows what event will trigger the stock bubble collapse. One
possibility is the ongoing financial implosion of the State of Illinois.
In stock bubble periods, all news is imbued with “the glass is half
full.” As an example, Illinois’ credit rating was reduced recently to
BB+/Baa3. That is a junk rating. But the media characterizes it as a
“the lowest investment grade” rating – i.e. the “glass is half full.”
Both rating agencies never downgraded Enron to junk until it was
weeks from Chapter 7 bankruptcy. Illinois is on the brink of financial
disaster. See this article as an example: Illinois Owes Billions.
This problem is absolutely dwarfed by Illinios’ public pension
problem, which Illinois underfunded by a couple hundred billion
(officially about $130 billion but that’s not on a true mark-to-market
basis).
When the music finally stops, the perma-bubble bulls will be looking
for that proverbial “seat” in all the wrong places. But the next
stampede of capital will be out of stocks, bonds, cryptos and
“investment” homes and into physical gold, silver and mining stocks.
The weekly update on the amount of crude oil inventories
in the United States is one of the most important pieces of data
regarding the oil market. Oil traders and analysts closely watch changes
in inventory levels and use them in their analyses and expectations for
oil prices. Inventory data is so important because the amount of oil
inventories serves as a proxy to oil demand. If crude oil inventories
increase weekly, it indicates that demand for oil is falling short of
supply, while if the oil inventories data shows a decline in oil
inventories, it indicates that demand is surpassing supply. With the
supply and demand balance one of the most crucial facts in a commodity's
price, this inventory data has a direct impact on oil prices. Live oil
prices often swing dramatically when the week-over-week change in oil
inventories is significantly different from what analysts forecast.
The two main reports that traders use for a reading on weekly
petroleum stockpiles are the reports released by industry group The
American Petroleum Institute (API) and the government report released by
the U.S. Energy Information Administration (EIA). Among the two
reports, The EIA report is more highly regarded. Find out why.
The American Petroleum Institute
The API is an industry group that represents American companies involved in producing, refining
and distributing petroleum and petroleum products. The API produces the
Weekly Statistical Bulletin, which reports on refinery operations and
production of the most important petroleum products that account for
more than 80% of total refinery production. Crude oil inventories are
included in this report. The API normally releases its Weekly
Statistical Bulletin on Tuesday at 4:30 p.m. ET. After a Monday holiday,
it is released on Wednesday.
The Energy Information Administration
The EIA publishes the EIA Weekly Petroleum Status Report on Wednesday
at 10:30 a.m. ET, but after a Monday holiday, it is released on
Thursday at 11 a.m. ET. The EIS report provides information on the
supply of oil and the level of inventories of crude oil and refined products.
Data Collection
The EIA requires major oil companies to complete their oil inventory
surveys. The EIA surveys include a stern disclosure for noncompliance or
intentional wrongdoing, and there are civil and criminal penalties for
failure to file accurate and timely data. The American Petroleum
Institute collects that data “at will,” but according to the API, the
average sample coverage of the API data is about 90%. The stern
disclosures the EIA data includes have analysts and traders believing
that the EIA’s data is more accurate that the API’s.
Congruency of Reports
The API data is often taken as a prelude to the EIA data, as it is
released the evening before the EIA report. There is definitely a
relationship between the two data sets; 80% of the time the data is
directionally aligned. While the data is often similar, at times there
have been large discrepancies. For example, on March 29, 2015, the API
reported that weekly crude oil inventories increased by 2.9 million
barrels, but the following day, the EIA reported an increase of 10.3
million barrels. Because there is a relationship, and due to the strictness of the EIA collection, it is relied upon in a higher regard.
Other Differences
Although traders may hold the EIA data in higher regard, they have
been relying on the API data for a longer period. Since 1929, the API
has been reporting oil inventory data weekly. The EIA started releasing
its weekly inventory report in 1979. Of note, the EIA also collects and
reports oil production data and, therefore, provides a more complete
picture of the state of the U.S. oil market.
"The numbers in this report can't be right -- and yet the
market is reacting to them!" -- there's a complaint we've heard so many
times about USDA reports, but this time it's the oil industry and the
weekly government crude oil inventory report that's in the spotlight.
Brian
Baskin, reporting for the Wall Street Journal last Friday, used
internal Dept. of Energy documents to uncover what he said were errors
in the Energy Information Agency's weekly inventory report, "including
one (last) September that was large enough to cause a jump in oil
prices, and a litany of problems with its data collection, including the
use of ancient technology and out-of-date methodology, that make it
nearly impossible for staff to detect errors."
The EIA has been releasing its weekly inventory report on
Wednesday mornings since the early 80s, and, like USDA's weekly export
sales, inspections, crop progress and crop production reports, the
report is "a major event for oil markets."
EIA "collects data from thousands of facilities, all
reporting the number of barrels held in storage around the nation. But
many of its systems haven't been updated for 30 years, and much of the
data input is done manually, according to one report commissioned for
the EIA, prepared by consultants SAIC Inc.," Baskin stated.
EIA's
director, Stephen Harvey, told Baskin he wasn't surprised with the
findings. The SAIC report concluded that EIA faces an uphill battle just
to maintain its current level of accuracy, although Harvey said the
agency has put in place some changes despite the lack of funding.
The
current version of the 2011 fiscal budget includes $18 million in
additional funding requested by Energy Secretary Steven Chu for the EIA,
the WSJ said.
For some perspective on the WSJ piece, DTN Refined
Fuels Editor Brian Milne and DTN Senior Analyst Darin Newsom shared the
following sentiments, "there has always been a question mark around the
EIA weekly reports. Some will look at the interrelation of data, i.e.
weekly output, imports, implied demand and the stock change, and say,
that doesn't add up. There's also a big sigh when the EIA does make a
revision. "This news will definitely trigger cynicism.
"However,
the data remains the best public information available. The EIA was
created 32 years ago to provide some sense of transparency in the
market. The event that triggered its creation was the OPEC's oil embargo
to western nations in the early 1970s. "Absent the EIA data, small
companies that don't have the resources to mine all of this data would
need to trust what the big companies tell them. Before the EIA was
created, the big companies knew what was going on, but the little guys
and the government were clueless.
"Every good analyst knows that a
week's worth of data does not make a trend. The problems found
internally and with the assistance of the consultant shows more caution
should be administered before putting on a trade solely based on the
results of the weekly data.
An
extraordinary metal that is vital to the electric car boom is facing a
critical shortage. One small company has positioned itself to profit
hugely from the coming price shock.
"Bottom line; the data will remain a critical component in oil trading."
The
WSJ article raises another question for DTN Senior Analyst Darin
Newsom. Newsom said, "I just don't buy the argument anymore that small
commercials or traders are at a disadvantage to larger entities, relying
on them for information. I hear the same thing all the time in the
grains as well. The fact is that in this day and age of instantaneous
information and heavily traded markets, market information is available
to all.
"I don't think EIA reports hold any more influence over
long-term energy traders than USDA reports do over grain traders. I
think the large money has moved well beyond these reports, realizing
they are as faulty as the article reports. That is one part of the
evolution of the markets that is actually in the right direction."
Milne
is not swayed by Newsom's argument. His response: "Question though;
how does government set energy policy void of data? Realizing that the
article is critical on the weekly reports, the EIA does a great deal of
long-term projections and studies. Data is not confirmed for months
later, and those surveyed for the information, including weekly surveys,
face large fines or worse for falsely reporting data.
"The amount
of energy consumption is critical to know when setting a broad array of
policy impacting all arrays of business as well as environmental
issues.
"And how do you have transparency without a supply base of
information? That transparency would dry up as quickly as Lehman's
assets ahead of its failure in 2008.
"Until all trades including
OTC are cleared on an exchange and reported in real-time, the market's
prices could be swayed by those armed with information. The small guy
would be at a disadvantage in oil trading absent some public or reliable
third party source of data. Absent the reports, the data sources would
be the oil majors and the big investment banks.
"If anything, the
article argues for more resources to get this correct. It can't be just
about trading; that's been gamed before."
By. Energy Hedge Funds
The US jobs market has been described as the backbone of the recovery – 82 months of continuous jobs growth with unemployment hitting 4.5% – the lowest since 2007. However the perceived strength in jobs creation is at odds with other economic indicators. President Trump ran on a campaign that repeatedly touted “jobs, jobs, jobs.” His emphasis on jobs creation and bringing employment back to America struck a chord with voters. Trump’s election in itself contradicts the popular narrative that the US jobs market is tight and robust. Wages, disposable income and real earnings growth along with low productivity and overall slow economic growth all challenge the BLS’s jobs numbers and thus Wall Street’s perception that the jobs market is tight. Since the monthly jobs report is eagerly awaited as the most important piece of economic data for financial markets, it warrants a deep dive in order to understand what is going on under the hood. Before we delve into the data, here are some highlights of our findings.
The Bureau of Labor Statistics (BLS) has been systemically overstating the number of jobs created, especially in the current economic cycle.
The BLS has failed to account for the rise in part-time and contractual work arrangements, while all evidence points to a significant and rapid increase in the so-called contingent workforce.
Full-time jobs are being replaced by part-time positions, resulting in double and triple counting of jobs via the Establishment Survey.
A full 93% of the new jobs reported since 2008 and 40% of the jobs in 2016 alone were added through the business birth and death model – a highly controversial model which is not supported by the data. On the contrary, all data on establishment births and deaths point to an ongoing decrease in entrepreneurship.


 More stocks rose than fell. Advancing issues on the New York Stock Exchange led decliners 1,691 to 1,273. Trading volume topped 1.2 billion shares. Nasdaq winners beat losers 2,476 to 1,826. More than 1.9 billion shares changed hands.


