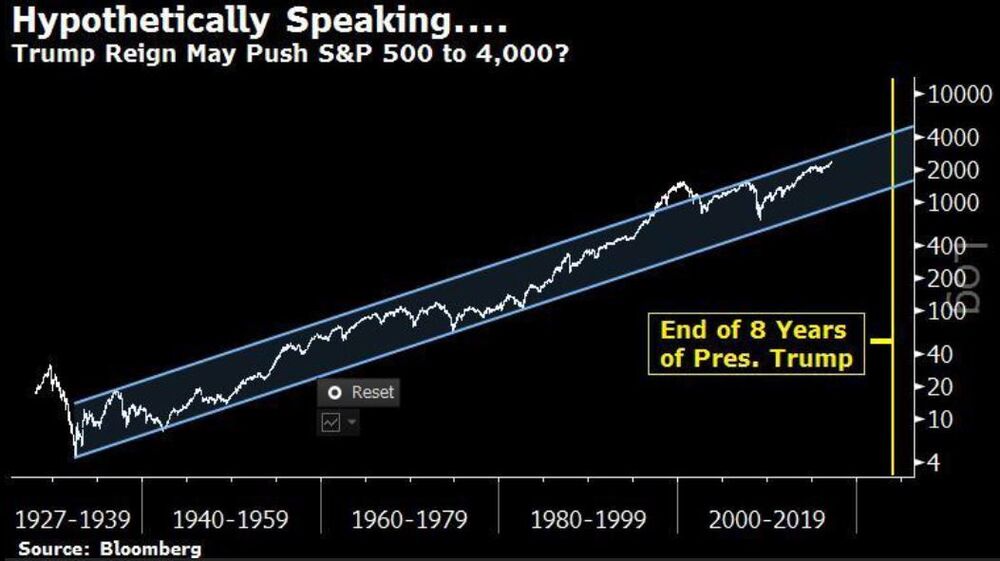
- 85-Year chart shows clear uptrend for U.S. stocks benchmark
- Internet bubble was only time index exceeded the upper boundDonald Trump’s first five weeks on the job have been pretty good for the stock market. By one measure, investors haven’t seen anything yet.
Based on technical analysis, where past charts are studied for clues on where a stock or index is headed regardless of fundamentals, an 85-year trend for the S&P 500 Index shows the equity benchmark could rise past 4,000 in the next eight years -- an 81 percent increase from its Monday close of 2,362.18.
Before anyone places a call to their broker, it must be noted the same trend channel is necessarily wide and its lower bound suggests the S&P 500 could fall as much as 42 percent to 1,375 by the time 2024 rolls around.
 Even amid the massive changes for the U.S. since 1932, from wars and manufacturing advances to technological progress and globalization, those two upward-sloping trend lines capture almost all of the stock market’s movements. Of course, there are violent periods of declines, as anyone who paid attention during the Internet-bubble crash or the Great Recession could attest. And there are long stretches with little change, such as the mid-1960s to 1980.
For technicians, the chart also contains two interesting points about the latest market bubbles and crashes. The only time the S&P 500 surpassed the upward bound was during the late 1990s Internet bubble. The index plunged about 50 percent from that March 2000 high to its low below 800 in October 2002.
During the 2008-2009 financial crisis, when the S&P 500 sank as much as 57 percent from its October 2007 record, the measure didn’t touch the lower end of the channel, suggesting the rout could have been worse than it was.
Wednesday, March 1, 2017
S&P 500 Could Top 4,000 in Eight Years and It's Not Because of Trump
https://www.bloomberg.com/news/articles/2017-02-28/s-p-500-could-top-4-000-in-8-years-and-it-s-not-because-of-trump
Subscribe to:
Post Comments (Atom)
No comments:
Post a Comment