Wednesday, March 29, 2017

How To Avoid A 401(k) Meltdown If The Trump Rally Fizzles

https://www.forbes.com/sites/johnwasik/2017/03/27/how-to-avoid-a-401k-meltdown-if-the-trump-rally-fizzles/#2fb2cf7619d3

Millions of Americans are asking the wrong questions when it comes to their retirement plans. It's not "how much should I invest now?" or "is the market safe?" You should invest as much as you can in every kind of market.
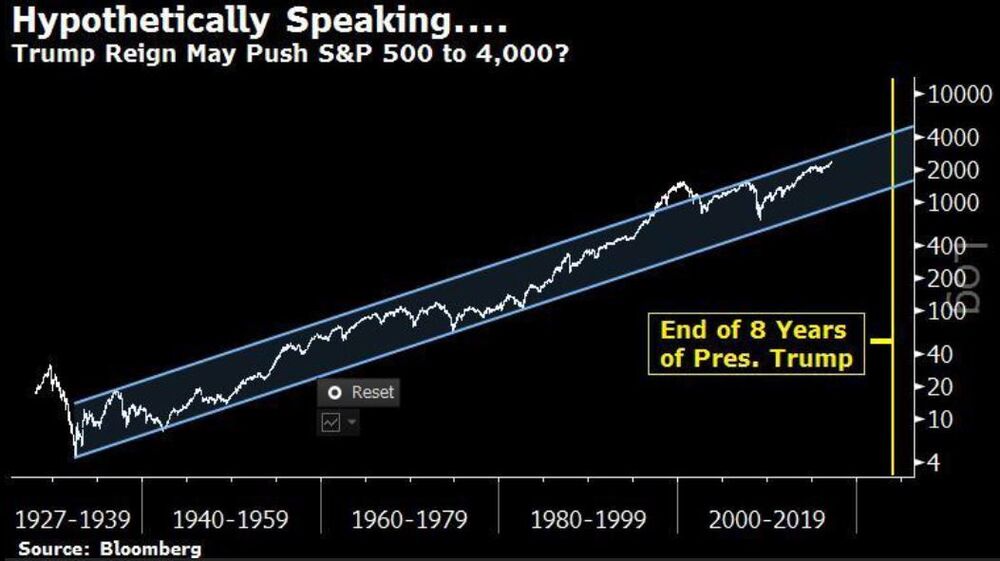
So forget about the question of whether the "Trump rally" is over, or taking a pause. If that's your concern, you're focused on the wrong thing.
Despite this reality, far too many investors are trying to find the right fund manager who can somehow predict and navigate the rocky seas the market will toss up. In rare cases, some managers get lucky and get in and out at the right time. But most don't have this ability.
Most of us want to believe that professional money managers know just when to get in and out of stocks. We put a lot of faith in them -- and mis-spend some $2 trillion in fees hoping that they'll be right and protect our money.
Shutterstock
The numbers don't lie, however. Most managers can't do better than passive market averages and rarely outperform after you subtract their fees. So if you're placing your trust in active management, you're headed for a meltdown sooner or later.
A recent study by Jeff Ptak at Morningstar shows the folly of active management for most investors.
Ptak looked a the relationship between what actively managed funds return to the fees they charge for management. In most cases, expenses will cancel out most significant gains.
"Fees haven't fallen that steeply, and, as a result more than two-thirds of U.S. stock funds levy annual expenses that would wipe out their estimated future pre-fee excess returns."
What this means is that active managers who time the market aren't likely to outperform passive baskets of stocks. When you subtract their fees, you're not coming out ahead.
Fees take an even bigger bite when overall market returns are lower. If stocks return less than double digits, you're going to feel the pain even more.
Ptak is blunt in his conclusion: "Many active stock funds are too expensive to succeed. The exceptions are small-cap funds, where it appears fees are still below estimated pre-fee excess returns."
What can you do to avoid the meltdown of overpriced, actively managed funds? It's a pretty simple process.
1) Find the lowest-cost index funds to cover U.S. and global stocks and bonds. Expense ratios shouldn't be more than 0.20% annually (as opposed to 1% or more for active funds).
2) If you still want active funds in your portfolio, they should be highly-rated managers who invest in smaller companies.
3) Make sure that the "active" part of your portfolio is no more than 30% of your total holdings. While this is an arbitrary percentage, it will provide some buffer against market timing decisions.
You should also avoid the error of picking funds based on their past performance, which can never be guaranteed. So, instead of asking how they performed, you should ask "how many securities can they hold for the lowest-possible cost."
John F. Wasik is the author of  "Lightning Strikes," "The Debt-Free Degree," "Keynes's Way to Wealth"and 13 other books on innovation, money and life. Follow him on Twitter and Facebook

Tuesday, March 21, 2017

Insider buying of gold stocks surges to multi-year highs

http://www.theglobeandmail.com/globe-investor/inside-the-market/insider-buying-of-gold-stocks-surges-to-multi-year-highs/article10312788/

The TSX global gold index has lost about a third of its value over the past two years. The S&P/TSX Venture Exchange, stock full of gold mining juniors, hit a multi-year low this month.
Yet, executives and officers who work within those businesses are showing remarkable confidence that the sector is poised for better times.
According to INK Research, there are now seven precious metals stocks on the TSX with insider buying for every one with selling. That’s a near doubling of the ratio since mid-January and represents a level of lopsided transactions that is usually only seen during major market peaks or valleys.
“That is the type of insider buying we saw in the broad market during the height of the great financial crisis in late 2008 and early 2009,” points out Ted Dixon, CEO of INK Research. “A similar situation now seems to be in place among gold and silver miners.”
Insiders are typically contrarian investors buying shares when they perceive them to be undervalued. Right now, it appears many think the stocks are going for fire-sale prices.
They are usually early, too. Historically, insider transactions often foreshadow market moves six- to 36-months in advance.
While that may be quite a wait, it’s interesting to see insiders display this level of confidence in a sector that the broader investment community has been fleeing.
Mr. Dixon points out that while gold is well off highs near $1,900 (U.S.) an ounce in 2011, the macro backdrop hasn’t radically changed. Central banks are working hard to keep real interest rates in negative territory, and the threat that bond-buying measures will eventually lead to inflation gold’s best friend remains intact.
There are no shortages of forecasts calling for gold’s demise, or at least losing some of its lustre. Last week, for instance, Société Générale predicted gold would pull back to below $1,400 (U.S.) an ounce by the end of this year as the U.S. economy improves and the need for quantitative easing is scaled back.
But there are plenty of others that are more optimistic. John Hathaway, manager of the $1.8-billion Tocqueville Gold Fund, who has one of the best long-term track records in the sector, thinks gold could easily vault 25 per cent from current levels to $2,000 an ounce. The recent events in Cyprus have highlighted the continued risks to the global economy arising from the European debt crisis, and gold could continue to benefit from haven flows into hard assets.
While gold stocks have significantly underperformed the bullion market recently for various reasons, including rising production costs, Mr. Dixon thinks miners have a lot of emerging factors working in their favour.
Several CEOs have recently been fired for investing in projects that ultimately hurt shareholder value, suggesting they'll be more prudent going forward. And technicals suggest gold stocks are cheap in relation to gold; last week, the NYSE Arch Gold Bugs index, made up of U.S.-listed gold companies, hit the lowest levels versus the SPDR Gold ETF an investment in physical metal since the Lehman Brothers collapse.
“Such extreme situations usually do not last for long,” notes Mr. Dixon. “With both fundamental and technical conditions supporting recent heavy insider buying, it looks like a significant bottom in precious metals mining shares may be in the process of forming now.”

Thursday, March 2, 2017

Dow Companies Report Worst Revenues since 2010, Dow Rises to 20,000

http://wolfstreet.com/2017/01/29/dow-component-companies-report-lowest-revenues-since-2010/


Dow Companies Report Worst Revenues since 2010, Dow Rises to 20,000 (LOL?)

Share on FacebookTweet about this on TwitterShare on LinkedInShare on Google+Share on RedditPrint this pageEmail this to someone

Wall Street hocus-pocus has done an awesome job.

The Dow-20,000 hats have come out of the drawer after an agonizingly long wait that had commenced in early December with the Dow Jones Industrial Average tantalizingly close to the sacred number before the selling started all over again.
What a ride it has been. From the beginning of 2011 through January 27, 2017, so a little more than six years, the DJIA has soared 73%, from 11,577 to 20,094. Glorious!!
But when it comes to revenues of the 30 Dow component companies – a reality that is harder to doctor than ex-bad-items adjusted earnings-per-share hyped by Wall Street – the picture turns morose.
The 30 Dow component companies represent the leaders of their industries. They’re among the largest, most valuable, most iconic American companies. And they’re periodically booted out to accommodate a changed world. For example, in March 2015, AT&T was booted out of the Dow, and Apple was inducted into it, as its ubiquitous iPhone had become the modern face of telecommunications. New blood with booming revenues replaces the stodgy old companies. In aggregate, revenues should therefore rise, right?
And there has been a huge binge of acquisitions, from mega-deals such as Verizon’s $130-billion acquisition of Vodafone in 2013, to the many dozens of smaller companies that Apple, Cisco, IBM, and others have bought. These mergers bring the revenues of the acquired companies into the revenues of the Dow components. And in aggregate, revenues of the Dow companies would therefore soar, right?
But the other day, I was asked about the revenues of all Dow components, after having lambasted the revenue debacles of two, IBM [Big Shrink to “Hire” 25,000 in the US, as Layoffs Pile Up] and Cisco [Cisco Buys 45th Company in 5 Years, Revenues Still Stagnate].
So here we go. Fasten your seatbelt.

The chart below shows total aggregate revenues as reported under GAAP by the 30 companies that are today in the DJIA. This includes Apple, for example, though it only joined in 2015; and it no longer includes AT&T. For 2016, these 30 companies reported aggregate revenues of $2.69 trillion. That’s down 4.4% from 2011 and the worst year since 2010:

OK, you say, it’s the oil bust’s fault. The energy companies did it. Sure enough, there are two huge energy companies in the Dow, Exxon Mobil and Chevron. Alas, their revenues started dropping long before the oil bust occurred. Revenues peaked in 2011 for both of them, at a combined $740 billion. By the end of 2014, before the oil bust hit in earnest, revenues had already dropped 16% to $624 billion. And by 2016, they were down to $351 billion, having plunged 53%.
Of the Dow components, four, including Exxon Mobil, have not yet reported their earnings for fiscal Q4 2016. To approximate revenues for the fourth quarter, I took the year-over-year growth rate of the first nine months and applied it to the revenues as reported in Q4 2015. It’s not perfect, but it’s close. And given the vast aggregate numbers – trillions – any divergence for that quarter gets lost in the rounding error.
So here are the revenues of the Dow components without Exxon Mobil and Chevron:

Ah-ha, you say. It’s all the oil bust’s fault. Without the oil companies that have been ravaged by the oil bust, revenues are fine. OK, maybe not fine. Revenues without the oil bust companies are up 13% since 2011. That’s an average annual growth rate of 2.5%, barely above the rate of inflation!
But the DJIA hit 20,000 with the oil majors in the average. So in looking at the relationship between aggregate revenues and stock price movements, we need to leave them in the mix.
And reality looks even worse. Apple, whose revenues have skyrocketed by over 1,000% since 2006, from $19.3 billion to $216 billion, became a Dow component in 2015, replacing AT&T. And its revenues weren’t part of the 30 Dow components until 2015. So here’s what the aggregate revenues of the Dow components look like without Apple (blue columns) and without Apple but with AT&T (brown columns). A pure stagnation fest:

In both scenarios, revenues in 2016 were lower than they had been in 2008. Only 2009 and 2010 were lower. So in terms of revenues, 2016 was for the Dow components ex-Apple the worst year since 2010! And this despite the five-year binge in acquisitions!
So how have the last two years been? Don’t even ask.


Of the 30 companies in the Dow, 16 sported declining revenues in 2016. And 17 sported declining revenues over the two-year span since 2014! Only two of them are oil companies! This table shows that inglorious list in all its beauty:

But the stock market is full of hocus-pocus, and actual revenues, as reported under GAAP, over time, are obscured the best way possible, just as magicians obscure their sleight of hand by distracting their audience with some flashy moves. So when I bring up “revenues,” everyone says, “Who cares about revenues?”
OK, I get it. It’s all about the adjusted ex-bad-items earnings-per-share – the Great American fiction – along with “leveraged share buybacks” funded with borrowed money, other forms of adroit financial engineering, and crowd-pleasing new metrics.
This relentless and eager focus on Wall Street hocus-pocus explains in part why the DJIA has soared 73% over the five years to 20,000 even as aggregate revenues, despite the delirious acquisition binge, have been mired down in a sea of stagnation.
The US economy hasn’t escaped the consequences of this corporate revenue stagnation, as hopes for a strong finish were gutted. Read… Back Below “Stall Speed”: 2016 Economy Matches Worst Year since Great Recession

Wednesday, March 1, 2017

S&P 500 Could Top 4,000 in Eight Years and It's Not Because of Trump

https://www.bloomberg.com/news/articles/2017-02-28/s-p-500-could-top-4-000-in-8-years-and-it-s-not-because-of-trump

  • 85-Year chart shows clear uptrend for U.S. stocks benchmark
  • Internet bubble was only time index exceeded the upper bound 
     
     Donald Trump’s first five weeks on the job have been pretty good for the stock market. By one measure, investors haven’t seen anything yet.
    Based on technical analysis, where past charts are studied for clues on where a stock or index is headed regardless of fundamentals, an 85-year trend for the S&P 500 Index shows the equity benchmark could rise past 4,000 in the next eight years -- an 81 percent increase from its Monday close of 2,362.18.
    Before anyone places a call to their broker, it must be noted the same trend channel is necessarily wide and its lower bound suggests the S&P 500 could fall as much as 42 percent to 1,375 by the time 2024 rolls around.
    Even amid the massive changes for the U.S. since 1932, from wars and manufacturing advances to technological progress and globalization, those two upward-sloping trend lines capture almost all of the stock market’s movements. Of course, there are violent periods of declines, as anyone who paid attention during the Internet-bubble crash or the Great Recession could attest. And there are long stretches with little change, such as the mid-1960s to 1980.
    For technicians, the chart also contains two interesting points about the latest market bubbles and crashes. The only time the S&P 500 surpassed the upward bound was during the late 1990s Internet bubble. The index plunged about 50 percent from that March 2000 high to its low below 800 in October 2002.
    During the 2008-2009 financial crisis, when the S&P 500 sank as much as 57 percent from its October 2007 record, the measure didn’t touch the lower end of the channel, suggesting the rout could have been worse than it was.