Gold Stocks Corrections in Bull Markets
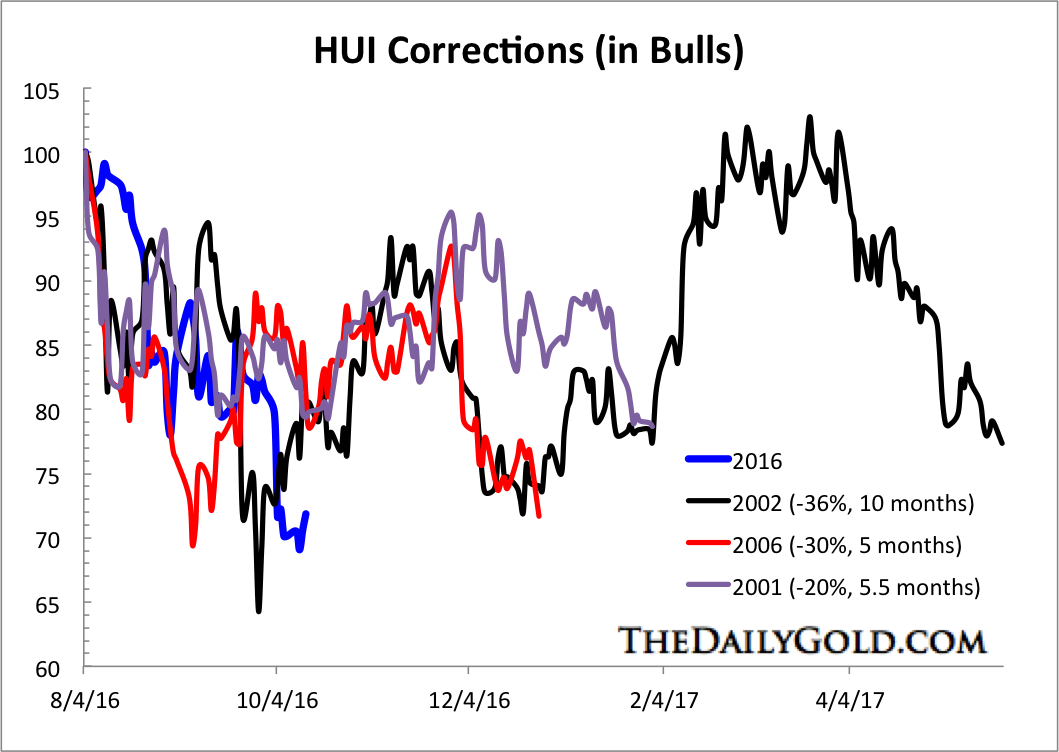
The chart below plots the current correction in the HUI index in comparison to the corrections in 2001, 2002 and 2006. Each correction followed very strong advances. The 2001 and 2002 periods are the best comparison to today. The recent rebound originated from a potential secular low (like 2001) and lasted six to seven months (like 2001). However, the rebound was much stronger than in 2001 and reached an extreme overbought point (like 2002). The HUI has already corrected 31%, which is much closer to the 2002 correction. Only time will tell how long the correction lasts but my view is it is more likely to last around six months than the 10 months seen in 2002.

Gold Stocks Correction Analog
The other important point to mention is every correction formed a typical A-B-C or down-up-down pattern. In other words, each correction served investors two buying opportunities (and three in the case of 2002). While we are likely at a short-term buying opportunity now, probability tells us that another one is coming in the next several months.
A variety of technical indicators (various moving averages, pivot points, Fibonacci retracements) gave us downside targets of GDX $22 and GDXJ $34-$35. That degree of downside is inline with the correction analog chart. While it may take another week for the sector to find a short-term low, the outlook over the next several weeks appears positive. Continue to accumulate on weakness and don’t be afraid to exercise some patience as more buying opportunities will be ahead. For professional guidance in riding the uptrend in Gold, consider learning more about our premium service including our favorite junior miners which we expect to outperform into 2017.
No comments:
Post a Comment