Arnold Van Den Berg discusses the following topics during his talk: · How he developed his investment philosophy and principles · How his experiences in the Holocaust influenced his philosophy and principles
The
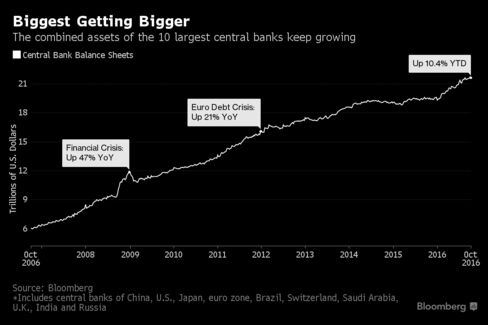
world’s biggest central banks are bulking up their balance sheets this
year at the fastest pace since 2011’s European debt crisis to boost
lackluster economic recoveries with asset purchases that are supporting
stock and bond prices.
The 10 largest lenders now own assets
totaling $21.4 trillion, http://www.bloomberg.com/news/articles/2016-10-16/big-central-bank-assets-jump-fastest-in-5-years-to-21-trillion
a 10 percent increase from the end of last
year, data collected by Bloomberg show. Their combined holdings grew by 3
percent or less in both 2015 and 2014.
The
accelerating expansion of central banks’ balance sheets comes as debate
rages over whether their asset purchases and continued low interest
rates are creating bubbles, especially in the bond market.
Such quantitative-easing programs are aimed at driving up the prices of
the securities they purchase to lower bond yields, encourage investment
and boost economic growth.
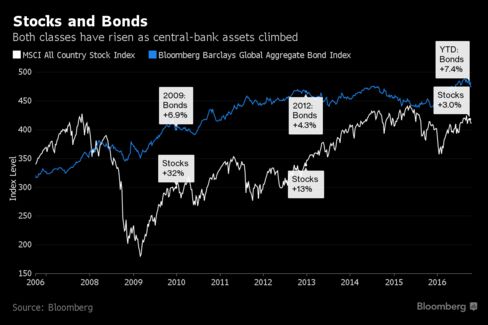
The
growth of central-bank holdings has coincided with the mostly upward
trend of stock and bond prices. As the top 10 expanded their balance
sheets by 265 percent since mid-October 2006, the MSCI All Country World
Index of equities gained 19 percent and the Bloomberg Barclays Global
Aggregate Index of bonds advanced 50 percent.
Over the past
decade, the Swiss National Bank expanded its holdings the most among
those with the largest portfolios, almost eight-fold in U.S. dollar
terms. The Bank of Russia was the least aggressive with a 68 percent
increase.
As the biggest banks’ holdings grew 10.4 percent this
year, the stock gauge gained 3 percent and the bond benchmark jumped 7.4
percent.
The
Bank of Japan and the European Central Bank together have expanded
their assets by $2.1 trillion since Dec. 31, more than accounting for
all of the top 10’s combined increase. The balance sheets of the
People’s Bank of China and the U.S. Federal Reserve fell 2 percent or
less as the Swiss and the Central Bank of Brazil boosted their holdings
15 percent or more.
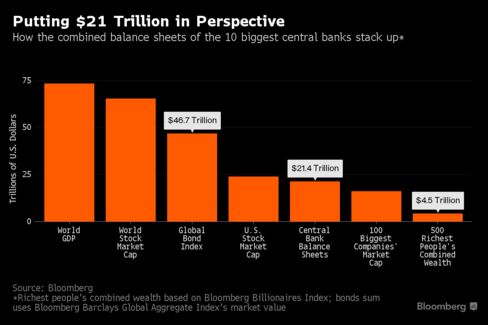
How much is $21.4 trillion?
It’s 29
percent of the size of the world economy as of the end of 2015, double
what it was in mid-September 2008, when Lehman Brothers Holdings Inc.’s
collapse sparked the global financial crisis. It’s a third of the
combined market capitalization of every stock in the world and almost
half the value of all debt in Bloomberg’s global bond index.
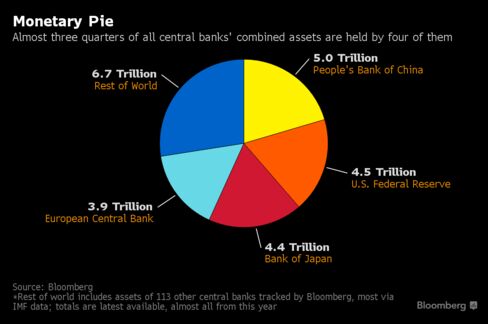
Almost
75 percent percent of the world’s central-bank assets are controlled by
policy makers in four places: China, the U.S., Japan and the euro zone.
The next six -- the central banks of Brazil, Switzerland, Saudi Arabia,
the U.K., India and Russia -- each account for an average of 2.5
percent. The remaining 107 central banks tracked by Bloomberg, mostly
with International Monetary Fund data, hold less than 13 percent.
Before it's here, it's on the Bloomberg Terminal.LEARN MORE
Investors are giving up on stock picking.
Pension
funds, endowments, 401(k) retirement plans and retail investors are
flooding into passive investment funds, which run on autopilot by
tracking an index. Stock pickers, archetypes of 20th century Wall
Street, are being pushed to the margins.
Over the three
years ended Aug. 31, investors added nearly $1.3 trillion to passive
mutual funds and their brethren—passive exchange-traded funds—while
draining more than a quarter trillion from active funds, according to Morningstar Inc.Advocates
of passive funds have long cited their superior performance over time,
lower fees and simplicity. Today, that credo has been effectively
institutionalized, with government regulators, plaintiffs' lawyers and
performance data pushing investors away from active stock picking.
In developed markets, “the pressure has gotten so great that passive has become the default,” said Philip Bullen,
a former chief investment officer at active-management powerhouse
Fidelity Investments. He and others say active management can succeed
with less widely traded assets.
The upheaval is shaking Wall Street.
Hedge-fund managers, the quintessential active investors, are facing mounting withdrawals
as they struggle to justify their fees. Hedge funds, which bet on and
against stocks and markets world-wide and generally have higher fees
than mutual funds, haven’t outperformed the U.S. stock market as a group
since 2008.
Some giants of passive investing, such as Vanguard Group and BlackRock Inc., are attracting lots of money and gaining clout in shareholder votes at public companies.
Although
66% of mutual-fund and exchange-traded-fund assets are still actively
invested, Morningstar says, those numbers are down from 84% 10 years ago
and are shrinking fast.
Performance
is driving the upheaval. Over the decade ended June 30, between 71% and
93% of active U.S. stock mutual funds, depending on the type, have
either closed or underperformed the index funds they are trying to beat,
according to Morningstar.
Moreover, because matching the performance of stock indexes is far cheaper than trying to beat them, index funds’ expenses are a fraction of what active funds charge—sometimes 1/30th or less. With interest rates near zero, fees stand out more than ever.
ENLARGE
There is a downside, according to active-investing
advocates. Passive funds are designed only to match the markets, so
investors are giving up the chance to outperform them. And if fewer
managers are drilling into financial reports to pick the best stocks and
avoid the worst—index funds buy stocks blindly—that could eventually undermine the market’s capacity to price shares efficiently.
That isn’t stopping one of the largest migrations of money in history.
“It is time to acknowledge the truth,” said a March shareholder letter from Cohen & Steers Inc., manager of real-estate and other specialized active funds. Stock
picking in its current form “is no longer a growth industry.”
Active-fund firms that don’t “position themselves for the sea change”
will be “relegated to the dustbin of history.”
This month, active manager Janus Capital Group Inc.agreed to sell itself to a British rival to diversify and help compete with lower-cost providers.
Employer-sponsored
401(k)-style retirement plans have 25% of their assets in index funds,
up from 19% in 2012, according to investment-consulting firm Callan
Associates Inc. Public pension plans had 60% of their U.S. stock
allocations in index funds in 2015, up from 38% in 2012, according to
research firm Greenwich Associates. At endowments and foundations, the
index-fund share rose to 63% from 40% in that time period.
The
biggest passive portfolio, Vanguard Total Stock Market Index Fund, now
has $469 billion in assets, nearly as much as the four largest active
funds combined. Fidelity’s 500 Index fund, at $103 billion, may soon
surpass the firm’s largest active portfolio, Contrafund, which holds
$108 billion.
Bob Chesner recently converted the $7.5
million 401(k) plan he oversees as chief operating officer of Austin,
Texas, law firm Giordani, Swanger, Ripp & Phillips LLP from a lineup
of mostly active funds to index funds.
“I was very much
a believer in active management,” he said. “I thought markets were
inefficient to the point where active management made a difference.”
A
few years ago, he noticed that the roughly 40 active funds in the law
firm’s menu were recovering from the 2008-09 market meltdown more slowly
than their benchmarks and the index funds that track them.
“That’s when it dawned on me that we were not doing something right,” he recalled.
In
the spring of 2014, over lunch, Mr. Chesner and the two other members
of the retirement plan’s executive committee decided on a change. By
going with an all-index-fund lineup, the firm’s employees would save an
average of 1.59 percentage points in annual expenses.
“When
you look at the fact that people are living longer, that makes a huge
difference” in retirement savings, said Mr. Chesner. “It’s almost a
no-brainer.”
ENLARGE
Lawsuits also are motivating investors to make changes. Over the past decade, Jerome Schlichter, a plaintiffs’ lawyer, has been suing corporations and, more recently, colleges and universities, contending the employers breached their fiduciary duty by allowing unreasonably high fees in their 401(k)-style plans.
Mr.
Schlichter’s cases, 40 in the past decade including 15 this year, “are
not saying that active management is per se imprudent,” he said.
Instead, they put the burden on a plan to show there is a reasonable
likelihood an investment will beat the market persistently after fees—“a
pretty big burden of proof,” he said, given active management’s costs
and record.
Companies and schools have generally defended their plans, calling them generous, well-designed and legal.
The
Illinois State Board of Investment, which oversees a $16 billion
defined-benefit pension plan and a $4 billion 401(k)-style plan for
state workers, voted Sept. 15 to convert the 401(k)-type plan to an all-index-fund lineup.
Board members were motivated mainly by a desire to reduce costs and make investment choices easier to understand.
With
index funds, “if you pick up a newspaper and see how the S&P
performed, you will know how your portfolio did,” said board Chairman Marc Levine. “They provide perfect transparency.”
The
fee lawsuits also influenced the decision, he said. At a recent
meeting, the board’s attorney “walked us through the potential liability
if there is harm to even a single participant,” he said. “It was quite a
wake-up call.”
Board members worried participants are
more likely to “chase performance” with active funds by piling into
portfolios that shine one year only to lag behind the next, said Mr.
Levine, a former investment banker. “If that manager concentrates the
investment portfolio and a stock blows up, that’s a potential legal
problem for us.”
The Illinois board will shift $2.8 billion from active funds at companies including Fidelity Investments, Invesco Ltd. and T. Rowe Price Group Inc. into index funds managed by Vanguard and Northern Trust Corp. The board expects the switch to reduce fees to 0.09%, from 0.37%.
Fidelity
and Invesco declined to comment. T. Rowe Price respects the Illinois
board’s decision, said a spokesman, but remains “confident in the value
added by our actively managed strategies.”
ENLARGE
When Stephen Sexauer, chief investment officer at the San
Diego County Employees Retirement Association, took over last year, the
public pension fund was paying an average of 1.1% in investment
expenses, nearly twice what comparable plans in other California
counties paid, without earning better returns, he said.
“You
have to ask yourself, ‘If we’re spending all this money on fees,
where’s the evidence of success?’ And it’s really hard to find,” he
said.
So the plan moved 25% of its assets—$2.5 billion at the time—into index funds charging average fees of .05%.
Mr.
Sexauer also placed $100 million in a so-called balanced portfolio of
70% stock index funds and 30% bond index funds. All the plan’s other
investments will be pitted, in a kind of tournament, against that
portfolio. If they don’t deliver, they will be axed, he said.
The
internal index fund “is kind of like Pac-Man,” he said. “If it
outperforms over time, eventually a capable administrative assistant
might be able to run the entire investment department, and we’d be OK
with that.”
“What’s going on is a generational shift,” said John D. Skjervem,
54 years old, chief investment officer of the Oregon State Treasury,
which oversees $90 billion in public assets and trust funds. “Guys like
me are moving in, and we had education that was empirically more
rigorous than the prior generation’s.”
Mr. Skjervem has
an M.B.A. from the University of Chicago Booth School of Business, known
for teaching that markets are efficient and stock picking is largely a
waste of time.
“When you adopt an empirical framework,
you expose a lot of storytellers,” he said. “I’m very uncomfortable in
the realm of the narrative. I want to listen to the data instead.”
Since John D. Skjervem
became chief investment officer of the Oregon State Treasury in 2012,
Oregon has shifted about $4 billion out of active funds, or about 15% of
the pension plan’s public-equity assets.
Photo:
Bruce Ely for the Wall Street Journal
Since Mr. Skjervem joined in 2012, Oregon has shifted about
$4 billion out of active funds, or about 15% of the pension plan’s
public-equity assets. Eventually, he said, the state may use traditional
active management for as little as 20% of its total public stock and
bond assets.
Over the past three years, Fidelity,
historically renowned for its active management, has launched nearly
two-dozen index mutual funds and ETFs, bringing its total passive lineup
to approximately 50 funds. Currently 12% of the $2.2 trillion it
manages is in index strategies, twice the level five years ago.
Fidelity
executives are “trying to help educate the marketplace that there is a
difference between all active and good active,” said Tim Cohen, the firm’s head of global equity research. In research released in March,
the firm found that among the 25% of all active U.S. large-stock mutual
funds with the lowest fees between 1992 and 2015, those from the five
largest firms outperformed their benchmarks, on average.
That
message hasn’t been an easy sell. “It’s been a tough period for the
industry, and flows certainly reflect that,” Mr. Cohen said.
Federal
regulations are pressuring investment fees, accelerating the move to
indexing, which is an easy way to cut costs. In 2012, the Labor
Department started requiring greater fee disclosure in 401(k) plans. The
fees on retail mutual funds in large 401(k)s have since fallen by 12%,
according to Callan Associates.
In April, the Department of Labor’s new so-called fiduciary rule is
scheduled to go into effect. Financial advisers overseeing individual
retirement accounts will have to demonstrate that their decisions are in
the best interests of their clients, a change that is expected to lead
to more fee-based accounts rather than accounts that use commissions
with the potential to lure brokers. By using index funds in accounts
already bearing an annual fee, brokers can help keep overall costs down.
BlackRock this month said it would lower costs on more than a dozen ETFs in light of the new rule. Morningstar expects the regulation could push as much as $1 trillion into passive investments.
Mr.
Bullen, the former Fidelity executive, now manages money for wealthy
families and uses a mix of passive and active funds. He also serves on
the investment committee of the approximately $480 million endowment of
the Whitehead Institute for Biomedical Research at the Massachusetts
Institute of Technology.
Though several of the eight
committee members are current or former heads of active firms, the
committee reached a unanimous decision to cease using active funds for
publicly traded securities, according to Mr. Bullen and others.
“The case for passive is being made so well and so clearly,” said Mr. Bullen, “it has become common wisdom.” Write to Anne Tergesen at anne.tergesen@wsj.com and Jason Zweig at intelligentinvestor@wsj.com
Desperate for yield, investors are buying government
bonds that come due further and further in the future. If you lend your
money to the government, you expect to get it back. It’s not for nothing
that British government bonds are ‘gilt-edged,’ and the U.S. Treasury
yield is considered ‘risk-free’ in financial models. What could possibly
go wrong?
Unfortunately, a lot. A small move in the yield on
these increasingly popular 40-, 50- and sometimes even 100-year bonds
can have a crippling effect on their capital value.
Anyone who might sell before they mature (hint:
that’s everyone alive today for the longest-dated bonds), should
consider how they'd feel if their supposedly safe bond had lost a
quarter of its value in two months. It happened to the rock-solid German
30-year bund, just last year.
This calculator lets you play with interest rates and
see just how big an impact changes to yield can have on the price of
long-dated bonds. You might be surprised by how big the losses could be,
if the drops in yield of the past couple of years go into reverse.
See how changing the yield moves the price of government bonds:
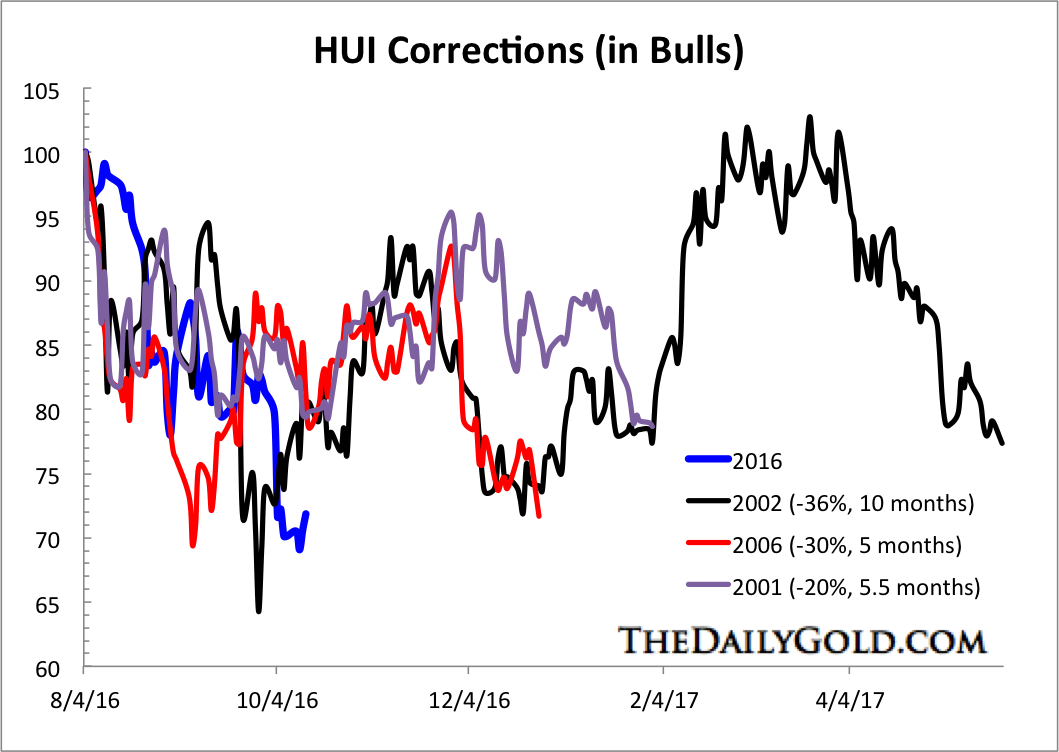
The
gold stocks are clearly in correction mode. The large caps (HUI, GDX)
have corrected 30% while the juniors (GDXJ) have held up well in
comparison by correcting the same amount. Given a number of factors (the
size of the previous advance, the recent technical damage, stronger US$
index and rising yields) the gold stocks should continue to correct and
consolidate in a larger sense. To gauge a potential path forward we
present a new analog chart and compare the current correction to those
from past markets. The
chart below plots the current correction in the HUI index in comparison
to the corrections in 2001, 2002 and 2006. Each correction followed
very strong advances. The 2001 and 2002 periods are the best comparison
to today. The recent rebound originated from a potential secular low
(like 2001) and lasted six to seven months (like 2001). However, the
rebound was much stronger than in 2001 and reached an extreme overbought
point (like 2002). The HUI has already corrected 31%, which is much
closer to the 2002 correction. Only time will tell how long the
correction lasts but my view is it is more likely to last around six
months than the 10 months seen in 2002.
Gold Stocks Correction Analog
The
other important point to mention is every correction formed a typical
A-B-C or down-up-down pattern. In other words, each correction served
investors two buying opportunities (and three in the case of 2002).
While we are likely at a short-term buying opportunity now, probability
tells us that another one is coming in the next several months. A
variety of technical indicators (various moving averages, pivot points,
Fibonacci retracements) gave us downside targets of GDX $22 and GDXJ
$34-$35. That degree of downside is inline with the correction analog
chart. While it may take another week for the sector to find a
short-term low, the outlook over the next several weeks appears
positive. Continue to accumulate on weakness and don’t be afraid to
exercise some patience as more buying opportunities will be ahead. For
professional guidance in riding the uptrend in Gold, consider learning
more about our premium service including our favorite junior miners
which we expect to outperform into 2017.
Mirror, mirror on the wall, which asset is most mispriced of all?
According to a Goldman Sachs alum who predicted the financial crisis in
2008, it’s gold.
The precious metal should be a lot more
expensive when the likelihood of a global financial collapse and a move
toward negative interest rates is accounted for, says Global Macro Investor founder Raoul Pal, who now sees a U.S. recession within 12 months.
Recent losses for gold may have dented investor confidence. Gold
GCZ6, -0.38%
is up 18% this year, but the
first full week of October marked its worst seven-day performance in
over three years; it also posted a three-month loss of nearly 6% on a
continuous basis.
Uncertainty about Brexit and the timing of a
Federal Reserve rate hike triggered a rush into the dollar, which often
moves inversely to the metal. (Higher rates can work against gold, but
the metal becomes a safe haven if the economy slows.)
“As
we get to negative interest rates, gold is a good place to park your
cash,” said Pal, who discussed his outlook with MarketWatch in a
September interview and a follow-up conversation over email.
“I’m
not a gold bug,” the former GLG Global Macro Fund co-manager — who is
also watching the dollar closely — “but this is the currency I would
choose now.”
Pal, an economist and strategist, also co-founded Real Vision TV, which conducts interviews with prominent investors. Many of his recent guests share his enthusiasm for gold, according to Pal.
“All the really serious thinkers are interested in gold,” he said.
How a U.S. recession could boost gold and the dollar
Pal’s
core presumption — one he’s held since 2014 — is bad news for the U. S:
He is convinced the country is headed for recession within a year. “The
business cycle points to that,” he said, “and 100% of all two-term
elections have had a recession within 12 months since 1910.”
His view contrasts with the Federal Reserve’s own indicator, based on corporate-bond spreads, that predicts just a 12% chance of a pullback in the next year.
But Pal does have some prominent company: Savita Subramanian, Bank of America’s head of equity strategy, recently predicted the same; Janus Capital’s Bill Gross spoke of a lagging U.S. recovery in his September investment note; and bond investor Jeffrey Gundlach showed a chart during a recent webcast that revealed the start of a recession. And Wilbur Ross sees one coming in 18 months.
Should
his prediction come true, Pal says, gold prices could double. If
central banks want to get active and combat a slowing economy, he says,
they will try to stimulate the economy via printing money or more
easing, all of which plays “into the hands of gold.”
This view
brings Pal to the asset he favors most over the next year out of bonds,
equities, currencies and commodities: the dollar. He told MarketWatch
he’d buy U.S. dollars, selling the euro, pound and Aussie dollar; he
expects the euro
EURUSD, -0.7506%
to eventually drop to 75 cents
against the dollar — about 3% below current levels — over time.
“The
world has shifted because of negative interest rates,” Pal said. “We
know the dollar will go higher, [and] gold may outperform over time, the
reason being because of negative interest rates. If I get it right, I
have dollars and gold…I don’t make much of a loss if that correlation
breaks.”
Year-to-date, the dollar index
DXY, +0.50%
is down nearly 1%, which some
blame in part on an inactive Fed. Interest-rate increases can have a
positive effect on a country’s currency by making it more attractive to
foreign investors.
But Pal insists that his dollar call is not
tethered to central bank policy, saying investors should let go of the
belief that those institutions are like “the Wizard of Oz.” Investors,
Pal said, believe the Fed’s policy choices can keep stocks from falling
even as Japan and Switzerland have proven otherwise. Read: Central banks ‘have never been on thinner ice’
The
Bank of Japan “has done more easing, as has the Swiss,” Pal said. “It’s
not achieved anything. Stock markets there have fallen, yet the market
wants to believe the Fed that there is an implicit put on the stock
market in the U.S.”
Switzerland has had negative interest rates in place since early 2015, yet stocks
SMI, +1.12%
fell 1.6% in 2015 and are down nearly 10% so far this year.
Japan moved to negative interest rates this year, yet the Nikkei 225
NIK, +0.49%
is down nearly 12%.
Real Vision
3-month Libor (inverted) versus Deutsche Bank shares
He believes the market is
currently short the dollar and should a banking crisis crop up in
Europe, he says, euros will get less attractive as investors prefer
dollars. In a recent interview on Real Vision, Pal discussed the problems at Deutsche Bank
DB, +0.71%
— but also how the problems extend far beyond Germany’s borders.
Spanish banks — ones like Banco Sabadell
SAB, +0.81%
Banco Popular
POP, +0.59%
— they’re all in free fall,
[at] all-time lows,” Pal said. Italian banks, with still unresolved bad
debt issues, are still a problem, and then Swiss and U.K. banks also
look unwell, he said.
“I think it’s the start of something,” he said of Deutsche Bank’s woes. Read: How Deutsche Bank is Lehman Brothers and how it isn’t
The
dollar, Pal said, also looks favorable against the backdrop of the
three-month U.S. dollar Libor (London interbank offered rate), the
benchmark rate some of the world’s biggest banks charge each other for
short term loans. When those rates are rising, he says, dollars are more
attractive.
In the last 12 months, Libor has nearly tripled, he said, moving from 0.31% to 0.88%.
“It
is also a sign that there is distress among dollar borrowers abroad, so
they might need to buy dollars to close out their risk,” said Pal.
Financial institutions, in other words, are fretting about potential
market downside, and when they get worried, the Libor moves higher.
The one chart he uses to track economic cycles
Pal is not a fan of U.S. stocks — the S&P 500 index
SPX, +0.22%
is up just 3.7% so far in 2016 —
largely because of what he sees in a chart he says that has failed him
just once when he didn’t trust it. Now, he says, it’s telling him his
recession prediction is spot on.
That chart is the Institute for Supply Management index,
which is based on surveys of more than 300 manufacturing firms and
gauges the health of the industry. The ISM rebounded in September, to
51.5% from 49.4% the previous month. But economists still say the U.S.
manufacturing sector faces challenging conditions.
“There’s a
difference between the narrative, which is what you’re being told,
versus the reality of the economic data,” said Pal. “It’s in no one’s
interest ahead of the election to say the U.S. economy is a mess —
[that] world trade freight shipments, container shipments, retail sales,
restaurant sales, factory orders, durable orders are all showing a
recession.”
Pal says the ISM correlates well with U.S. assets.
“It peaked in 2011 and has been bouncing around 50 for a while now,” he
said. “The moment it starts to get to 47, 46, the odds of a full-on
recession explode to 85%. We’re very close now, getting to the point
where the probability is very high.”
Real Vision
Pal’s go-to chart showing ISM versus the S&P 500 (year over year)
The ISM is one reason he’s
not keen on U.S. stocks, as he says he prefers to be underweight when
they are near all-time highs, then wait for the business cycle to bottom
— generally, 12 to 18 months after the start of a recession based on
past bear markets — before getting back in.
“It could be a
shallower recession,” Pal says, but “the probability is that most last
around that period of time and investors need to be aware of that.” (A
fuller explanation of his thinking can be found in a June video Real
Vision posted on YouTube.)
And Pal urges investors not to
expect Fed interest rate increases to sustain a bull market. Even if the
central bank raises rates several times over the next two years, he
says, they will still be low. “Interest rates follow the economic cycle
and do not lead it. As the economy weakens, the government cuts interest
rates.”
In other words, he says the Fed is always reactive — never proactive.
More from MarketWatch
Central banks have leapt to the forefront of public
policy-making. They have taken responsibility for lowering interest
rates (and keeping them low), for maintaining stability of financial
institutions and markets and for buying up large-scale quantities of
government debt to help economies recover from recession. Now it seems
that they have become important, too, in building up holdings of
equities to increase depleted yields on their much-increased reserves of
foreign currencies.
Central banks may be over-stretching
themselves. Jens Weidmann, president of Germany's Bundesbank – which
retains a highly important role in the euro area – spoke yearningly
last week of the need for "central banks to shed their role as
decision-makers of last resort and, thus, to return to their normal
business". He said this "would help to preserve the independence of
central banks, which is a key precondition to maintaining price
stability in the long run."
Central banks' foreign
exchange reserves have grown unprecedentedly fast – especially in the
developing world. The same authorities that are responsible for
maintaining financial stability are often the owners of the large funds
that add to liquidity in many markets and can cause the risk of
overheated asset prices.
Evidence of equity-buying by
central banks and other public sector investors has emerged from a
large-scale survey compiled by Official Monetary and Financial
Institutions Forum (OMFIF), a global research and advisory group. The
OMFIF research publication Global Public Investor (GPI) 2014, launched
on June 17 is the first comprehensive survey of $29.1 trillion worth of
investments held by 400 public sector institutions in 162 countries.
The report focuses on investments by 157 central banks, 156 public
pension funds and 87 sovereign funds, underlines growing similarities
among different categories of public entities owning assets equivalent
to 40% of world output.
The assets of these 400 Global
Public Investors comprise $13.2 trillion (including gold) at central
banks, $9.4 trillion at public pension funds and $6.5 trillion at
sovereign wealth funds. In the aftermath of the financial crisis,
different forms of "state capitalism" have come to the fore, the report
says: "Whether or not this trend is a good thing may be open to
question. What is incontestable is that it has happened."
Sovereign
wealth funds and public pension funds are well known to have become
large holders of company shares on international stock markets. The
best-known example is the Norwegian sovereign fund, Norges Bank Investment Management
(NBIM), with $880bn under management of which more than 60% is invested
in equities. The fund owns on average 1.3% of every listed company
globally.
It now appears that NBIM has rivals from a number of unexpected sources. One is China's State Administration of Foreign Exchange (SAFE), part of the People's Bank of China, the biggest overall public sector investor, with $3.9 trillion under management, well ahead of the Bank of Japan and Japan's Government Pension Investment Fund (GPIF), each with $1.3 trillion.
SAFE's
investments include significant holdings in Europe. The PBoC itself has
been directly buying minority equity stakes in important European
companies.
Another large public sector equity owner is Swiss National Bank,
with $480 billion under management. The Swiss central bank had 15% of
its foreign exchange assets – or $72 billion – in equities at the end of
2013.
Central banks have been trying to compensate for
lost revenue caused by sharp falls in interest rates driven by official
institutions' own efforts to repair the financial crisis. According to
OMFIF calculations, central banks around the world have foregone $200
billion to $250 billion in interest income as a result of the fall in
bond yields in recent years. GPIs as a whole appear to have built up
their investments in publicly quoted equities by at least $1 trillion in
recent years, in a trend that is now probably irreversible.
These
shifts have important implications for transparency and accountability
of official asset management. Sovereign funds have adopted the
so-called Santiago Principles on transparency, but central banks have
not signed up to any comparable code.
Edwin "Ted" Truman, a former senior Federal Reserve official, now a senior fellow of the Peterson Institute for International Economics, writes in GPI 2014:
"One of any government's major responsibilities is managing the
country's international assets. Reforms are urgently needed to enhance
the domestic and international transparency and accountability for this
activity – in the interests of a better-functioning world economy." David Marsh is managing director and founder of the Official Monetary and Financial Institutions Forum in London.http://www.usatoday.com/story/money/markets/2014/06/15/david-marsh-new-force-in-world-markets-global-public-investors/10548183/
Jeremy Siegel's latest column in Yahoo Finance responds to John Hussman and others, who argue that Siegel's irrational bullishness is setting him up to be
come a modern-day Irving Fisher. Siegel's response: The critics are
wrong, profit margins are fine, valuations should be higher, and stocks
are going up.
Siegel's main arguments are these:
The hand-wringing about "record-high profit margins soon
reverting to means" is misplaced because 1) a greater percentage of U.S.
corporate profits are coming from international operations, which
aren't affected by U.S. GDP, and 2) a greater percentage of overall U.S.
profits are now captured by public U.S. companies instead of private
ones.
Innovations in the financial system, namely lower trading costs
and smarter central banks, have reduced the equity risk premium. Thus,
stocks should now trade at an average P/E of about 20-times, instead of
the long-term average of about 14-times.
Siegel, in other words, believes that "it's different this time." And that's reasonable--because sometimes it is
different this time (the most salient example being a permanent change
in the relationship between bond yields and dividend yields after the
U.S. went off the gold standard--a change that cost many "prudent"
investors to miss decades of gains). Of course, more often than not,
it's NOT different this time, and those who argue that it is end up with
egg on their faces (believe me--I know).
I'll wait for Hussman, Grantham, Smithers, DeLong and others to
respond to Siegel's arguments before taking a strong stand here. I will
simply suggest that the big lesson from most major bull markets is
this: anytime someone argues that "it's different this time," the burden
of proof ought to be on them (as opposed to on bears who
appear to be "wrong" because the market keeps going up). With this in
mind, I'd like to see more data from Siegal backing up his profits
argument--a chart showing the percentage of U.S. profits generated from
international operations over time, for example, as well as a chart of
global profits relative to global GDP (are profit margins at record
highs globally, as well?).
The "risk premium" argument obviously won't be settled until after
the fact, but in my mind there's an easy counter to that one: Today's
risk premium is low because stocks haven't been that risky
recently--even with the crash of 2001-2002, global equities are sharply
higher than they were 10 years ago. Go through a couple of decades of
stagnation, meanwhile, like the periods that followed market highs in
1929 and 1966, and investors won't give a damn about low transaction
costs or more enlightened central banks. Instead, because stocks will
seem like the worst investment idea anyone ever thought of, investors
will once again demand a huge equity risk premium.
 ENLARGE
 ENLARGE
 ENLARGE

 Real Vision
 Real Vision
 Jeremy Siegel's latest column in Yahoo Finance responds to John Hussman and others, who argue that Siegel's irrational bullishness is setting him up to be
come a modern-day Irving Fisher. Siegel's response: The critics are
wrong, profit margins are fine, valuations should be higher, and stocks
are going up.
Jeremy Siegel's latest column in Yahoo Finance responds to John Hussman and others, who argue that Siegel's irrational bullishness is setting him up to be
come a modern-day Irving Fisher. Siegel's response: The critics are
wrong, profit margins are fine, valuations should be higher, and stocks
are going up. Jeremy Siegel's latest column in Yahoo Finance responds to John Hussman and others, who argue that Siegel's irrational bullishness is setting him up to be
come a modern-day Irving Fisher. Siegel's response: The critics are
wrong, profit margins are fine, valuations should be higher, and stocks
are going up.
Jeremy Siegel's latest column in Yahoo Finance responds to John Hussman and others, who argue that Siegel's irrational bullishness is setting him up to be
come a modern-day Irving Fisher. Siegel's response: The critics are
wrong, profit margins are fine, valuations should be higher, and stocks
are going up.