I can only say: I'm sorry, America. As a
former Federal Reserve official, I was responsible for executing the
centerpiece program of the Fed's first plunge into the bond-buying
experiment known as quantitative easing. The central bank continues to
spin QE as a tool for helping Main Street. But I've come to recognize
the program for what it really is: the greatest backdoor Wall Street
bailout of all time.
Tuesday, November 19, 2013
Wednesday, October 16, 2013
More Evidence Pointing to Manipulation in Gold Market? By Michael Lombardi
More Evidence Pointing to Manipulation in Gold Market? By Michael Lombardi
While I avidly follow the actions of central banks to see where the gold bullion prices may be headed next, when I look at them today, their actions are speaking louder than words.
Central banks have pretty much stopped selling gold bullion, which is very important. In 1999, a number of central banks in Europe formed an alliance and agreed that they would not sell more than 400 tonnes of gold bullion per year. The agreement was called the Central Bank Gold Agreement (CBGA). In 2004, the CBGA was renewed again; this time the limit was 500 tonnes. Once again, it was renewed for another five years in 2009, and the limit is back to the sale of no more than 400 tonnes of gold bullion per year. The table below shows how much gold bullion the central banks in Europe sold in each period of the CBGA. (Source: World Gold Council web site, last accessed October 11, 2013.)
 Notice anything different? The central banks in Europe have put the
brakes on their sales of gold bullion. In fact, from September 27, 2012
to September 26, 2013, these central banks only sold 5.1 tonnes of gold
bullion! This is hands down the lowest amount sold since the agreement
started in 1999.
Notice anything different? The central banks in Europe have put the
brakes on their sales of gold bullion. In fact, from September 27, 2012
to September 26, 2013, these central banks only sold 5.1 tonnes of gold
bullion! This is hands down the lowest amount sold since the agreement
started in 1999.
When it comes to stocks, if owners of a stock aren't selling and there's a significant number of buyers who want to buy, the price of the stock usually goes up as the simple rule of economics come into play: supply and demand.
Sadly, when it comes to gold bullion prices, this is not the case. Gold bullion prices are actually going down despite less supply and more demand. The price action in the gold market doesn't make sense. What if all the conspiracy theories I keep reading about in respect to gold bullion prices being manipulated are right?
As I ponder manipulation in the gold bullion market, I heard recently that the U.S. Justice Department is looking into manipulation in the $5.0-trillion-a-day foreign exchange market. Traders in big banks around the global economy are accused of manipulating key exchange rates. (Source: Reuters, October 11, 2013.) If the biggest market in the global economy can be manipulated, why can't the gold bullion market be manipulated?
I'm sticking to my guns; the depressed prices of well-managed senior and junior gold-producing companies are a screaming opportunity for investors.
Originally posted at Profit Confidential (c) Michael Lombardi, MBA
While I avidly follow the actions of central banks to see where the gold bullion prices may be headed next, when I look at them today, their actions are speaking louder than words.
Central banks have pretty much stopped selling gold bullion, which is very important. In 1999, a number of central banks in Europe formed an alliance and agreed that they would not sell more than 400 tonnes of gold bullion per year. The agreement was called the Central Bank Gold Agreement (CBGA). In 2004, the CBGA was renewed again; this time the limit was 500 tonnes. Once again, it was renewed for another five years in 2009, and the limit is back to the sale of no more than 400 tonnes of gold bullion per year. The table below shows how much gold bullion the central banks in Europe sold in each period of the CBGA. (Source: World Gold Council web site, last accessed October 11, 2013.)
When it comes to stocks, if owners of a stock aren't selling and there's a significant number of buyers who want to buy, the price of the stock usually goes up as the simple rule of economics come into play: supply and demand.
Sadly, when it comes to gold bullion prices, this is not the case. Gold bullion prices are actually going down despite less supply and more demand. The price action in the gold market doesn't make sense. What if all the conspiracy theories I keep reading about in respect to gold bullion prices being manipulated are right?
As I ponder manipulation in the gold bullion market, I heard recently that the U.S. Justice Department is looking into manipulation in the $5.0-trillion-a-day foreign exchange market. Traders in big banks around the global economy are accused of manipulating key exchange rates. (Source: Reuters, October 11, 2013.) If the biggest market in the global economy can be manipulated, why can't the gold bullion market be manipulated?
I'm sticking to my guns; the depressed prices of well-managed senior and junior gold-producing companies are a screaming opportunity for investors.
Originally posted at Profit Confidential (c) Michael Lombardi, MBA
Tuesday, October 15, 2013
Saturday, October 12, 2013
Did Cyprus really sel its Gold?
Cyprus Finance Minister Sees Gold Sale Within Next Months
http://www.bloomberg.com/news/2013-04-17/cyprus-central-bank-must-approve-gold-sale-finance-chief-says.html
http://www.zerohedge.com/contributed/2013-07-17/cyprus-resists-international-pressure-sell-gold-reserves
Gold Prices/Fixes/Rates/Vols - (Bloomberg)
Gold is lower in all major currencies today but remains well bid near the $1,300/oz level.
Physical demand, particularly from China, remains very robust and premiums high at over $30 per ounce overnight.
Physical gold delivered to buyers by China’s largest bullion bourse in the first half of this year almost matched the entire amount taken from its vaults in 2012 (see Shanghai Gold Exchange charts below), and was more than double the country’s annual production.
Breaths will be held prior to Bernanke’s testimony but as ever it will be prudent to ignore the noise and his often contradictory words and focus on actions and the reality of continuing ultra loose monetary policies.
Cyprus is resisting pressure from the European Commission (EC) and International Monetary Fund (IMF) to sell its gold reserves to finance its “bailout”.
Yesterday the Cypriot Finance Minister said that a sale of its gold reserves was not the only option under consideration to pay down its debt and that other alternatives were being considered.
Cyprus has 13.9 tonnes (c. 447,000 troy ounces) of gold reserves which are worth some 436 million euros at today’s market prices.
The international bailout imposed on Cyprus involved 10 billion euro ($13 billion) and therefore the Cypriot gold reserves are worth a mere 4.36% of the bailout.
"The possibility of selling gold is known, but only as an option," Finance Minister Harris Georgiades told reporters. He did not elaborate on what the alternatives were according to Reuters.
The government in Cyprus may realise that in the event of Cyprus leaving the euro and returning to the Cypriot pound, their gold reserves could provide support to the fragile newly launched national currency.
International lenders have imposed a 10 billion euro bailout on the country, which was forced to seize bank deposits in two major banks in radical new “bail-ins” to finance the sudden “bail out” in March.
Monday, October 7, 2013
Wednesday, October 2, 2013
Tuesday, October 1, 2013
update on Gold's Correction
http://theshortsideoflong.blogspot.com/2013/09/golds-correction.html

I received a lot of questions regarding the precious metals sector in recent weeks, esepcially since the relief rally has stopped.
This years correction in the precious metals sector has been very notable, and also quite welcome (if you are planning to invest into the sector). After all, Gold rose for 12 annual years in the row and was eventually due for a down year (or two) just based on common sense and extreme overbought levels in the monthly charts.
While many investors claim that the bull market for commodities, and precious metals in general, is over - majority of these investors were the same ones who missed the huge gains over the last 12 years in the first place. In other words, even a broken clock can be right twice a day...

Chart 1: GLD ETF holdings portray a picture of panic in the PM area

Source: Short Side of Long
I received a lot of questions regarding the precious metals sector in recent weeks, esepcially since the relief rally has stopped.
This years correction in the precious metals sector has been very notable, and also quite welcome (if you are planning to invest into the sector). After all, Gold rose for 12 annual years in the row and was eventually due for a down year (or two) just based on common sense and extreme overbought levels in the monthly charts.
While many investors claim that the bull market for commodities, and precious metals in general, is over - majority of these investors were the same ones who missed the huge gains over the last 12 years in the first place. In other words, even a broken clock can be right twice a day...
Chart 2: Three major corrections during a secular bull market in Gold

Source: Short Side of Long
The current correction in Gold, which from peak to trough has declined
almost 40% at one point, is probably not over just yet. It is rare for
markets to bottom on a V trough, similar to what we saw in early July.
And while some investors will point out that the 1975/76 correction
recovered from a V trough, I would like to add that back then, the price
of Gold was extremely oversold relative to current conditions. Prices
were down almost 50% in just over 400 trading days.
Either way, I am expecting Gold to build a base from which a new bull market rally will start in due time. These patterns and bases usually look like double or triple bottoms of some kind, so I urge investors to stay patient and let Gold do its thing. This also means that there is a possibility of prices breaking towards new lows temporarily.
Either way, I am expecting Gold to build a base from which a new bull market rally will start in due time. These patterns and bases usually look like double or triple bottoms of some kind, so I urge investors to stay patient and let Gold do its thing. This also means that there is a possibility of prices breaking towards new lows temporarily.
U.S. third quarter earnings warning ratio is second worst since 2001
(Reuters) - U.S. companies are warning about third-quarter earnings at a rate lower than last quarter but still at the second highest level since 2001, leaving estimates well below what they were just three months ago.
Companies issuing negative outlooks for the quarter outnumber positive ones by 5.2-to-1, the most negative since the 6.3-to-1 ratio in the second quarter.
The second-quarter ratio is the worst since the first quarter of 2001. The third quarter would be the second worst since 2001, according to Thomson Reuters data.
As a result, third-quarter earnings for Standard & Poor's 500 companies were expected to increase by 4.6 percent compared with a year ago, down from a forecast of 8.5 percent on July 1.
"I think companies have done exactly what they do in the confessional month every cycle. They try to talk the numbers down so they can engineer an upside surprise," said Phil Orlando, chief equity market strategist at Federated Investors in New York.
S&P 500 companies have beaten analysts' earnings expectations, on average, by 67 percent over the last four reporting periods.
Technology is the sector with the highest number of third-quarter negative outlooks, with 27 warnings. Among them was Autodesk Inc (ADSK.O), which anticipates lower demand for its computer-aided design software used in construction, manufacturing and engineering.
Consumer discretionary companies have the second highest number of warnings, including Target Corp (TGT.N). Target said in August that shoppers remained cautious and that its new Canadian stores were not doing as well as anticipated.
Consumer discretionary companies, however, were expected to post earnings growth of 7.3 percent for the third quarter, the third highest of the S&P 500 sectors after financials and telecommunications, according to Thomson Reuters data.
Mike Jackson, founder of investment firm T3 Equity Labs in Denver, sees S&P 500 energy, financials and industrials as sectors more like to surprise to the upside, while utilities, telecommunications and consumer staples are the least likely.
But, he noted, "there's a lot of noise right now that's driving sector performance, and not the fundamentals."
Stock investors have been worried as the U.S. Congress, which was still in partisan deadlock on Monday over Republican efforts to halt President Barack Obama's healthcare reforms, was on the verge of shutting down most of the U.S. government, starting Tuesday morning.
(Reporting by Caroline Valetkevitch; Editing by Jeffrey Benkoe)
Nearly 50% of CFOs think shares overvalued Commentary: Surprisingly bearish finding of Duke CFO survey
http://www.marketwatch.com/story/nearly-50-of-cfos-think-shares-overvalued-2013-10-01
HAPEL HILL, N.C. (MarketWatch) — As if stock market bulls didn’t already have enough to worry about, with a looming government shutdown and the threat of a U.S. Treasury default.
HAPEL HILL, N.C. (MarketWatch) — As if stock market bulls didn’t already have enough to worry about, with a looming government shutdown and the threat of a U.S. Treasury default.
Yet they do: It turns out that nearly half of companies’ chief financial officers think the stock market is overvalued.
That surprisingly bearish result is among the findings of the latest
Duke CFO Magazine Global Business Outlook survey: 40.2% of chief
financial officers who responded to the latest survey said they thought
the stock market is overvalued and will correct downward.
Duke finance professor Campbell Harvey, one of the survey’s authors,
says that he finds this high a percentage to be “striking” because CFOs
“usually tell us that their stock is undervalued.”
Washington turmoil spooking business world
Washington's budget standoff is spooking businesses and consumers, threatening the recovery even if lawmakers avoid a government shutdown or a potentially catastrophic default on the nation's debt.
In fact, Harvey added, the Duke survey for the last several years didn’t
even ask CFOs whether they thought their stocks were undervalued, since
when they did ask the question in the years before that the CFOs’
answers were “stuck above 95%.”
The Duke CFO survey is conducted quarterly. This latest survey is based
on a poll of 530 CFOs in the days leading up to Sept. 6. The Dow Jones Industrial Average
DJIA
+0.41%
on that day, it is interesting to note, closed just below the 15,000
level — about 200 points below where it trades today. So, even taking
into account the market’s pullback over the last week, the decline that
many of the CFOs were then anticipating has yet to materialize.
It behooves us to pay attention to this survey’s finding because, as
Harvey pointed out, CFOs usually “have the best handle” of anyone in the
corporate hierarchy on expected cash flows.
Though the CFOs no doubt had many reasons to believe the stock market is
overvalued, one common theme may be the threat of higher interest rates. Only 7% of them believe that long-term interest rates will fall from current levels.
You might be inclined to question these results on the grounds that
“talk is cheap:” It would be a far more bearish omen if CFOs, along with
other corporate insiders, were backing their words with actions —
aggressively selling shares of their companies in the open market. And
that doesn’t appear to be the case.
I wouldn’t be so quick to dismiss the survey’s results, however.
Anonymity in this case might actually induce the CFOs into being more
willing to reveal their true feelings. After all, they may see their job
as being a cheerleader for their companies’ stocks. Therefore, when
speaking on the record, or executing open-market transactions in their
companies’ shares before all the world to see, they may feel compelled
to behave more bullishly than they really believe is justified.
If so, get ready for market fireworks in coming weeks and months.
Mark Hulbert is the founder of Hulbert Financial
Digest in Chapel Hill, N.C. He has been tracking the advice of more
than 160 financial newsletters since 1980. Follow him on Twitter
@MktwHulbert.
Thursday, September 26, 2013
Thursday, August 22, 2013
It’s not time to turn bullish on gold equities: Citi Research
http://blogs.marketwatch.com/thetell/2013/08/13/its-not-time-to-turn-bullish-on-gold-equities-citi-research/
The Citi analysts forecast gold prices will average $1,185 an ounce in the second half of 2013, and fall to $1,143 in 2014.
Wednesday, August 21, 2013
Tuesday, July 23, 2013
Did Fabulous Fabrice Really Cause the Financial Crisis
Did Fabulous Fabrice Really Cause the Financial Crisis
Here is a reminder from Greg Palast, who is one of those rarest of creatures, the investigative journalist, about what caused the last financial crisis, and the source of the criminogenic environment that is likely to be a major contributing factor to the next.
The Banks must be restrained, and the financial system reformed, with balance restored to the economy, before there can be any sustainable recovery.
"...In August 2007, hot-shot hedge fund manager John Paulson walked into Goldman Sachs with a brilliant plan to cash in on the US housing crisis.
He paid Goldman to announce that Paulson would invest a big hunk of his fund's wealth, $200 million, in securities tied to the US mortgage market’s recovery. A few lucky investors would be allowed to give Goldman their billions to bet with Paulson that Americans would not default on their home mortgages.
It was a con. Secretly, Paulson would bet against the mortgage market, hoping it would collapse – making sure it would collapse. All he needed was Goldman to line up the suckers to put up billions to be his "partners".
It was Goldman’s and Paulson's financial version of Mel Brooks' The Producers, in which a couple of corrupt theatre producers schemed to suck investors into a deliberate flop...
What did the Feds do to Paulson? He received... a special tax break.
Am I defending the Fabulous Fabrice, the French-fried scapegoat? After all, he was just along for the ride. But he was deeply thrilled to carry water for the Bad Boys. And the charges against him are merely "civil", meaning he won't get jail time even if found guilty.
And what about Goldman, whose top brass knew of the entire game? The Securities and Exchange Commission did fine Goldman for its duplicity – a sum equal to 5 percent of the cash Goldman got from the US Treasury in bail-out funds.
After Goldman’s con became public, its CEO, Lloyd Blankfein was hailed as a visionary for offloading mortgage-backed securities before the shit hit the finance fan. Blankfein hailed himself for, he said, "doing God's work". God did well. Blankfein’s bonus in 2007 brought his pay package to $69 million for the year, a Wall Street record.
Rather than prison or penury, Blankfein was appointed advisor to Harvard University’s business and law schools.
So here’s the lesson all Harvard students are taught: If you can't do the time, don't do the crime... unless your booty exceeds a billion."
Read the entire piece by Greg Palast here.

Monday, July 22, 2013
![ggimage20_072213_thumb[1]](https://lh3.googleusercontent.com/blogger_img_proxy/AEn0k_s2wA05lBvvTrc04sd_ghzyXxEUREH4Td6dsgc42DKIuk9fxYqJ4PPecaZLXJU3q2c097LRGSRhHjOBLgBKGQRcRtta0XdQ8eMGbdOLDnNeObIUyuhTny7Zy7CAq69EKTr-KEFhsccdwEvHjeJ_lK--Y5RDu-gjzf4rsEw2380AaaV8SJXN1pfLhnAUU_fbVCycsXbHLD2iLIpBnbwmnoMu3DcdpymHQZ63OD53tapsOudDqtUuHVX8gf66YjFb4Bs=s0-d "ggimage20_072213_thumb[1]")
A Shuffle of Aluminum, but to Banks, Pure Gold
http://www.nytimes.com/2013/07/21/business/a-shuffle-of-aluminum-but-to-banks-pure-gold.html?pagewanted=1&=_r=6&_r=2&&
.
.
Others now fear that Wall Street banks will repeat or revise the tactics
that have run up prices in the aluminum market. Such an outcome, they
caution, would ripple through the economy. Consumers would end up paying
more for goods as varied as home plumbing equipment, autos, cellphones
and flat-screen televisions.
Robert Bernstein, a lawyer at Eaton & Van Winkle, who represents
companies that use copper, said that his clients were fearful of “an
investor-financed squeeze” of the copper market. “We think the S.E.C.
missed the evidence,” he said.
Saturday, July 20, 2013
run for your gold, there is not enough for all -Reuters
"The current dislocation indicates that holders of gold futures have begun demanding delivery. But because of the large amount of leverage in the market, participants are not able to deliver on their obligations."
Reuters, Gold Futures Hiccup Indicates Demand Outpacing Supplyhttp://www.reuters.com/article/2013/07/19/derivatives-gold-idUSL1N0FP1CB20130719
A dislocation in the gold futures market indicating that demand for physical delivery of the metal is now far outweighing supply has intensified in recent weeks, increasing concern in the market that the change may not be a momentary blip and participants may have become over-leveraged.
Gold went into backwardation in comparison to the three-month futures contract in early January, meaning the spot price rose above the short-dated future contact. Now that process looks set to creep out the futures curve to longer-dated maturities, signalling some cause for alarm.
"The fact that has remained and widened ... indicates that the physical market has tightened up substantially, a postulation that is corroborated by the growing premiums being paid ... and the ongoing wholesale delays in the delivery of substantial bullion tonnage," wrote Ned Naylor-Leyland of Cheviot Asset Management in a report this month.
"The bullion banks want to get gold back into contango and stop the movement of the remaining inventories by shaking the market lower, using paper leverage to do so," wrote Naylor-Leyland.
"It hasn't worked, indeed more and more investors are now seeking allocation, delivery and physical metal at the expense of synthetic products offered by the banks. The squeeze we have been waiting for is closing in, it is always darkest just before dawn."
Thursday, July 18, 2013
JP Morgan Chase, Once Considered "The Good Bank," Is About to Pay Another Massive Settlement
In the three-year period between 2009-2012, Chase paid out over $16 billion in litigation costs. Noted financial analyst Josh Rosner of Graham Fisher slammed Chase in a report earlier this year, pointing out that these settlements and legal costs represented a staggering 12% of Chase's net revenue during this time. There couldn't possibly be a clearer demonstration of the modern banking model, in which companies break rules/laws as a matter of course, and simply pay fines as a cost – a significant cost – of doing business.

China reportedly planning to back the yuan with gold
http://rbth.asia/business/2013/07/17/china_reportedly_planning_to_back_the_yuan_with_gold_47997.html
Recent media reports suggest that Beijing is considering backing the yuan with gold. This decision, if taken, will likely affect China's economy and may trigger a new wave of the global economic crisis. For Russia, however, such a scenario may have its benefits.
According to media reports of early July, the People's Bank of China is mulling the possibility of phasing out the dollar as the reference currency for the yuan exchange rate, and to start using gold as the reference point.
The reports have not been confirmed officially, but analysts are warning that the step, if taken, will weaken the yuan and destabilise China's already troubled economy, ultimately provoking a new bout of the economic crisis worldwide.
Beijing's possible move to back the yuan with gold would not be meant as a strategic measure to strengthen the national currency and increase its attractiveness as an investment medium. Rather, it would be a flaunt aimed at demonstrating to the world (and to the USA in particular) that China is capable of taking the risks associated with a departure from the dollar standard. Experts warn however that, apart from benefiting no-one, such a decision may actually have catastrophic consequences.
Argentina Beats Vietnam for Gold Premium
At the time my friend decided to buy gold, the price was about
US$1,700. If we include the premium, it cost him US$1,800 at the
6-to-1 exchange rate. In black market terms, this fiasco cost him
10,800 pesos per ounce. If he was allowed to purchase gold legally, it
would have only cost 8,100 pesos. That’s a premium of 25% or US$600!
Monday, July 15, 2013
The Bernanke Conundrum
The Bond Vigilantes
This is what the bond market is already starting
to do in fits and spurts. But we haven`t seen anything yet by the bond
vigilantes. The only thing we have seen so far is an $80 Billion
withdrawal from bond funds as investors try to protect principal. Make
no mistake we haven’t even begun to experience any vigilantism in bond
markets.
When this happens the worst thing the fed can do
is try to fight them as the perception that they are out of touch
further erodes credibility, and the market becomes panic stricken where
normal valuations and previous models go out the window.
Thursday, July 11, 2013
Gold is most oversold ever!
http://theshortsideoflong.blogspot.com/2013/07/charts-of-day-precious-metals-sector.html

Regular readers of this blog should know by now that I consistently track annualised performance of various asset classes. This indicator is commonly referred to 12 month rate of change or a yearly rolling performance. The first chart we are focusing on, seen above, shows that the current Gold correction is the most oversold ever (Gold started trading freely on COMEX in early 1970s). The corrections of 1971, 1976, 1982, 2001 and 2008 were all sharp, where the price fell almost 2 standard deviations away from its average annualised percentage movement.
In 1999, Gold became so oversold, that the price moved over 2 standard deviations away from its mean. That became known as a secular bear market bottom and one of the greatest buying opportunities over the last decade. Fast forward to today, and what is even more interesting is the fact that Gold has now become the most oversold ever, even suppressing those 1999 conditions. On the daily basis, as Gold traded below $1200 per ounce in recent weeks, the price was almost 3 standard deviations away from its annualised mean. What we have here, is one of the most important contrarian "buy signals" in the precious metals sector over the last 50 years!


Source: iMarket Signals / dShort
Regular readers of this blog should know by now that I consistently track annualised performance of various asset classes. This indicator is commonly referred to 12 month rate of change or a yearly rolling performance. The first chart we are focusing on, seen above, shows that the current Gold correction is the most oversold ever (Gold started trading freely on COMEX in early 1970s). The corrections of 1971, 1976, 1982, 2001 and 2008 were all sharp, where the price fell almost 2 standard deviations away from its average annualised percentage movement.
In 1999, Gold became so oversold, that the price moved over 2 standard deviations away from its mean. That became known as a secular bear market bottom and one of the greatest buying opportunities over the last decade. Fast forward to today, and what is even more interesting is the fact that Gold has now become the most oversold ever, even suppressing those 1999 conditions. On the daily basis, as Gold traded below $1200 per ounce in recent weeks, the price was almost 3 standard deviations away from its annualised mean. What we have here, is one of the most important contrarian "buy signals" in the precious metals sector over the last 50 years!
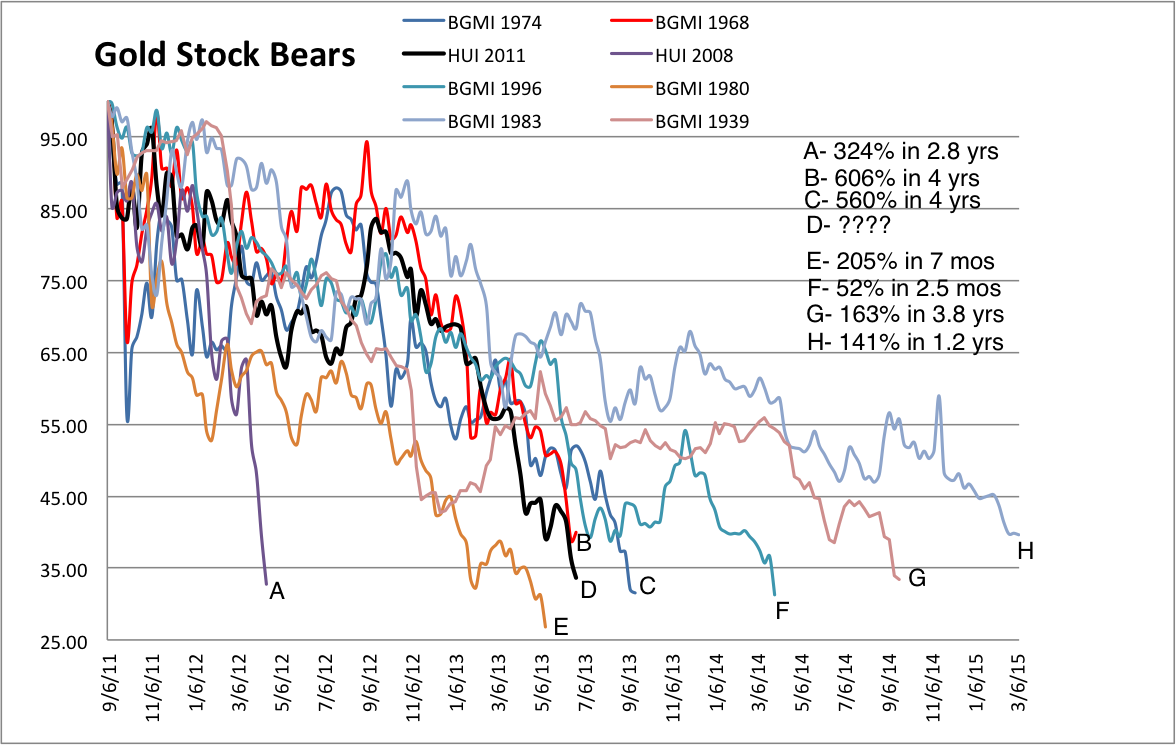
Chart 2: Gold miners hold similarities to the greatest oversold conditions

Source: The Daily Gold
Another friend of mine, who runs a great precious metals newsletter over
at The Daily Gold, recently sent me a chart of Gold Mining equities
that he compiled dating back to 1930s. Essentially, the chart shows that
regardless of weather Gold is in a secular bull or a secular bear
market, the sharpest corrections over the last 80 years have averaged
about 65% on the downside.
From there, various observations can be made. Personally, the current
correction (labeled D) is currently one of the strongest out of 8 major
sell offs since 1939. We are more then 65% down from the all time highs
(just about the average of all others too), but more importantly
corrections are not only measured in percentages, but also in time.
With that in mind, we can easily see that the current correction is one
of the sharpest, only third behind the infamous crash of 1980 (the end
of the secular bull) and the global financial crisis of 2008 (Lehman
panic). Observing the chart above and taking into context the historical
price action comparison, we could assume that Gold Miners are either
near or at a major low as we speak.
Chart 3: South African mining industry has now entered into total disarray

Source: Bank Credit Analyst
Wage inflation and general employment conditions are usually a favourite
tool of economists and Wall Street analysts. Those guys (and girls)
love to follow lagging data to tell us how good (or bad) the current
conditions are. However, as contrarian investors, we have to remember
that markets are usually discounting the future events and fundamental
conditions today, and at times look forward 6 to even 12 months in front
of what the current data says. As I always say, investing is about
anticipating the future.
South Africa is traditionally known for its strong precious metals industry and high global exports. If we look at the chart above, the current employment conditions have reached dreadful levels. Previous similarities can be seen during 1993, 1999 and 2006 downturns. As mining conditions deteriorate, the supply that was planned for the future usually does not come on board (just like we saw in 1999), so the market starts discounting up-and-coming shortages. Therefore, current conditions could be foretelling another major contrarian buying opportunity.
Interestingly enough, looking at the South African annual mining wage change and comparing it to the price, we can see how Gold (and other precious metals) tend to find a bottom just as conditions turn awful. Consider the fact that in 1993, 1999 and 2006 Gold found major bottoms out of which it rallied powerfully, so I would not be surprised at all that we are nearing another major low as we speak.
What I Am Watching
Wednesday, July 10, 2013
Tuesday, July 9, 2013
$1 billion of gold has been shipped from New York to South Africa this year
http://qz.com/83396/1-billion-of-gold-has-been-shipped-from-new-york-to-south-africa-this-year/
Examining US trade data, we were surprised to see that South Africa’s $402 million trade surplus with the United States in January had turned into a $689 million deficit by March. Why?

It turns out the $1.1 billion swing is entirely due to unusual shipments of gold from the US to South Africa in February and March. So far this year, 20,013 kg of unwrought gold, worth $982 million, has left John F. Kennedy International Airport (JFK), in New York, for somewhere in South Africa, according to the US Census Bureau’s foreign trade division. (Unwrought gold includes bars created from scrap as well as cast bars, but not bullion, jewelry, powder, or currency.)
The shipments from JFK were the only unwrought gold to leave the US for South Africa in 2013; another large shipment occurred in September 2012.

South Africa has an enormous mining industry, and a lot of the material leaves the country–$1.72 billion worth of precious stones and metals were exported in March according to the South African Revenue Service. Although the country’s gold output has been falling steadily for decades, it remains one of the world’s largest producers and is still primarily an exporter. In fact ordinary South Africans are legally prohibited from importing or owning unwrought gold. (Refiners, dealers, and jewelers are granted licenses.)
However, the strikes that rocked South Africa’s mining industry last year briefly caused gold output to fall sharply, around the same time as last autumn’s big gold shipment from JFK. Overall 2012 production declined by a relatively modest 6% (pdf) over the year before, according to a preliminary figure from the US Geological Survey; but those first estimates have sometimes proven wide of the mark. (In 2009 the USGS estimated South Africa’s 2008 production to be 250 tons; it subsequently revised the figure to 213 tons.) So it could be that the strikes dealt a more severe blow to the country’s gold industry than the data show.
Still, even if gold output did fall precipitously, it’s not clear why South Africa would need to start importing it. One possible destination for the gold is the South African Mint, which produces legal-to-own gold coins called Krugerrands; the gold used in them is first refined by the Rand refinery. Calls to the South African embassy in Washington, DC were not returned.
(Update May 17: The Rand refinery released a statement claiming responsibility for the gold imports.)
The data do not imply that the gold originated from the New York area, only that JFK was the gold’s final point of transit before it made its way to South Africa. For instance, a US domestic cargo carrier could have delivered the gold to an international carrier in New York, who in turn hauled it across the Atlantic. The amount of unwrought gold exported through JFK has more than doubled in recent years.
In 2012, 335,204 kg was transported from the airport to other countries, up from 148,894 kg in 2009.

The shipments to South Africa amount to 16% of all unwrought gold exported through JFK in the first three months of 2013 and 9% of all unwrought gold exported from the US this year.

All the gold was not necessarily shipped at the same time. However, if it was, it would take up no more space than a washing machine. The Boeing 747-200, a cargo model of the distinctive jumbo jet, is capable of transporting a shipment six times heavier than the 20,013 kg exported so far this year. That’s all we know.
If you have a better theory about (or the full story behind) these gold shipments, feel free to get in touch.
Examining US trade data, we were surprised to see that South Africa’s $402 million trade surplus with the United States in January had turned into a $689 million deficit by March. Why?
It turns out the $1.1 billion swing is entirely due to unusual shipments of gold from the US to South Africa in February and March. So far this year, 20,013 kg of unwrought gold, worth $982 million, has left John F. Kennedy International Airport (JFK), in New York, for somewhere in South Africa, according to the US Census Bureau’s foreign trade division. (Unwrought gold includes bars created from scrap as well as cast bars, but not bullion, jewelry, powder, or currency.)
The shipments from JFK were the only unwrought gold to leave the US for South Africa in 2013; another large shipment occurred in September 2012.
South Africa has an enormous mining industry, and a lot of the material leaves the country–$1.72 billion worth of precious stones and metals were exported in March according to the South African Revenue Service. Although the country’s gold output has been falling steadily for decades, it remains one of the world’s largest producers and is still primarily an exporter. In fact ordinary South Africans are legally prohibited from importing or owning unwrought gold. (Refiners, dealers, and jewelers are granted licenses.)
However, the strikes that rocked South Africa’s mining industry last year briefly caused gold output to fall sharply, around the same time as last autumn’s big gold shipment from JFK. Overall 2012 production declined by a relatively modest 6% (pdf) over the year before, according to a preliminary figure from the US Geological Survey; but those first estimates have sometimes proven wide of the mark. (In 2009 the USGS estimated South Africa’s 2008 production to be 250 tons; it subsequently revised the figure to 213 tons.) So it could be that the strikes dealt a more severe blow to the country’s gold industry than the data show.
Still, even if gold output did fall precipitously, it’s not clear why South Africa would need to start importing it. One possible destination for the gold is the South African Mint, which produces legal-to-own gold coins called Krugerrands; the gold used in them is first refined by the Rand refinery. Calls to the South African embassy in Washington, DC were not returned.
(Update May 17: The Rand refinery released a statement claiming responsibility for the gold imports.)
The data do not imply that the gold originated from the New York area, only that JFK was the gold’s final point of transit before it made its way to South Africa. For instance, a US domestic cargo carrier could have delivered the gold to an international carrier in New York, who in turn hauled it across the Atlantic. The amount of unwrought gold exported through JFK has more than doubled in recent years.
In 2012, 335,204 kg was transported from the airport to other countries, up from 148,894 kg in 2009.
The shipments to South Africa amount to 16% of all unwrought gold exported through JFK in the first three months of 2013 and 9% of all unwrought gold exported from the US this year.
All the gold was not necessarily shipped at the same time. However, if it was, it would take up no more space than a washing machine. The Boeing 747-200, a cargo model of the distinctive jumbo jet, is capable of transporting a shipment six times heavier than the 20,013 kg exported so far this year. That’s all we know.
If you have a better theory about (or the full story behind) these gold shipments, feel free to get in touch.
Monday, July 8, 2013
Dow Will Hit 60,000 in 20 Years: Ron Baron
http://finance.yahoo.com/news/dow-hit-60-000-20-124549767.html
"Money is running from bonds and gold. I think people investing in bonds can have significant capital depreciation over the next several years," he said in an interview.
"Companies have almost doubled their earnings in the past 13 years while stock prices have increased only about 25 percent," he said.
On June 20, a day when investors were heading for the hills and the market was down sharply, Ron Baron's Baron Capital saw its strongest inflows of the year.
The markets plunged that day after Federal Reserve Chairman Ben Bernanke indicated the central bank was getting ready to exit its extreme monetary easing program.
When asked about the recent equity market sell-off that accompanied Fed
fears, the renowned buy-and-hold investor stressed buying and selling
on news is not a good strategy.
(Read More: One Eye on Earnings, the Other on Bonds ) "Money is running from bonds and gold. I think people investing in bonds can have significant capital depreciation over the next several years," he said in an interview.
"Everyone thinks they are advantaged by trading on news. They are not.
This is why the average investor in mutual funds makes 3 percent per
year while the average mutual fund earns 7 percent per year." Baron
added.
"Investors who base their buy and sell decisions on
current news generally sell and buy at exactly the wrong times. It's
crazy," he continued."Companies have almost doubled their earnings in the past 13 years while stock prices have increased only about 25 percent," he said.
Expecting stock market returns for the next 20 years to approximate the 7 percent annual returns earned by U.S. stocks for generations, Baron quoted Albert Einstein that "the most powerful force in the universe is compound interest."
He said in his opinion based on the compounding effect, "the Dow Jones will be 30,000 in 10 years, 60,000 in 20 years."
Baron is putting his money behind his words. Tuesday, July 2, 2013
Mish Buys a Basket of Miners
http://globaleconomicanalysis.blogspot.com/2013/06/mish-buys-basket-of-miners.html
Most of my investment funds are under management at Sitka Pacific. I also have investments with GoldMoney and some other assets from my late wife Joanne.
I believe precious metal miners represent true value, but I cannot state when the market will come to the same conclusion.
Last week I bought a basket of miners with a significant amount of money. Many of these stocks are also held in various Sitka Pacific strategies.
Mish Miner Basket
General Comments
As you can see, most of the investment is with major mining companies that pay substantial dividends. PEs are trailing, not optimistic or unrealistic forward estimates. Price per book value is low in most cases. Each symbol is a clickable link to Yahoo!Finance statistics.
Gold Stock Comments
Silver Stock Comments
As you can see I weighted the basket 82% gold to 18% silver which reflects my belief that gold is a far safer play. None of these picks constitutes a recommendation in any way. Please do your own due diligence.
Most of my investment funds are under management at Sitka Pacific. I also have investments with GoldMoney and some other assets from my late wife Joanne.
I believe precious metal miners represent true value, but I cannot state when the market will come to the same conclusion.
Last week I bought a basket of miners with a significant amount of money. Many of these stocks are also held in various Sitka Pacific strategies.
Mish Miner Basket
| Symbol | Average Price | Initial Weight | PE | Dividend | Yield |
|---|---|---|---|---|---|
| NEM | $34.08 | 30% | 10.06 | $1.40 | 4.10% |
| GG | $29.18 | 15% | 15.70 | $0.60 | 2.10% |
| ABX | $20.64 | 15% | NA | $0.80 | 4.00% |
| GDX | $29.60 | 10% | 11.00 | NA | 1.20% |
| GLDX | $16.73 | 5% | NA | NA | 6.52% |
| HMY | $4.08 | 5% | 11.73 | $0.10 | 2.30% |
| SBGL | $3.38 | 2% | NA | NA | NA |
| SLW | $23.72 | 9% | 14.22 | $0.48 | 2.00% |
| PAAS | $12.65 | 9% | 42.38 | $0.50 | 4.10% |
General Comments
As you can see, most of the investment is with major mining companies that pay substantial dividends. PEs are trailing, not optimistic or unrealistic forward estimates. Price per book value is low in most cases. Each symbol is a clickable link to Yahoo!Finance statistics.
Gold Stock Comments
- NEM - Newmont Mining: My best value play and weighted accordingly. Price/book is a mere 1.19 and I have no reason to believe book value is overstated. Trailing PE is 10.04 and the dividend yield is 4.10%. What's not to like?
- GG - Goldcorp: A major Canadian gold miner with a respectable PE and dividend. Goldcorp trades right at book value (.99 to be precise).
- ABX - Barrick Gold Corporation: Another major Canadian gold miner with a respectable dividend. Earnings were negative last quarter due to writedowns. Dividend appears solid. Price/per book is a mere .88 (less than book value).
- GDX - Market Vectors Gold Miners ETF. Rather than pick too many additional stocks and following them all, I put 10% of my basket into a gold miners ETF basket.
- GLDX - Global X Gold Explorers ETF. This is a speculative play on gold explorers. Some of the companies in the ETF are likely to go bust. Hopefully some will strike it big. I weighted this according to risk, with only 5% of my basket.
- HMY: Harmony Gold Mining Company Limited: This is a South African mining company that stands to appreciate from its gold mining operations and also from a falling Rand.
- SBGL - Sibanye Gold Limited: This is another South African miner and arguably my most speculative play. It is weighted accordingly at 2% of the basket.
Silver Stock Comments
- SLW - Silver Wheaton Corp: SLW has a respectable PE and pays a reasonable dividend. It is a play on the price of silver which I expect to recover at some point.
- PAAS - Pan American Silver Corp: PAAS is a major silver producer with a nice dividend yield of 4.10%. Pan American is trading at 68% of book value.
As you can see I weighted the basket 82% gold to 18% silver which reflects my belief that gold is a far safer play. None of these picks constitutes a recommendation in any way. Please do your own due diligence.
Whip inflation now
http://en.wikipedia.org/wiki/Whip_inflation_now
Whip Inflation Now (WIN) was an attempt to spur a grassroots movement to combat inflation, by encouraging personal savings and disciplined spending habits in combination with public measures, urged by U.S. President Gerald Ford. People who supported the mandatory and voluntary measures were encouraged to wear "WIN" buttons,[1] perhaps in hope of evoking in peacetime the kind of solidarity and voluntarism symbolized by the V-campaign during World War II.
The campaign began in earnest with the establishment by the 93rd Congress, of the National Commission on Inflation, which Ford closed with an address to the American people, asking them to send him a list of ten inflation-reducing ideas.[2] Ten days later, Ford declared inflation "public enemy number one" before Congress on October 8, 1974, in a speech entitled "Whip Inflation Now", announcing a series of proposals for public and private steps intended to directly affect supply and demand, in order to bring inflation under control. "WIN" buttons immediately became objects of ridicule; skeptics wore the buttons upside down, explaining that "NIM" stood for "No Immediate Miracles," or "Nonstop Inflation Merry-go-round," or "Need Immediate Money."
In his book The Age of Turbulence, Alan Greenspan as the Chairman of the Council of Economic Advisors recalled thinking "This is unbelievably stupid" when Whip Inflation Now was first presented to the White House. According to historian Yanek Mieczkowski, the public campaign was never meant to be the centerpiece of the anti-inflation program.[3]
Ritholz on Gold and on Making Predictions
http://globaleconomicanalysis.blogspot.com/2013/07/ritholz-on-gold-and-on-making.html
Grave Dancing
Ritholtz claims to be agnostic regarding gold. I suggest his current hyperbole proves otherwise, even though he once liked the metal.
For the record, Ritholtz is a good guy, we just happen to disagree regarding gold.
And I certainly side with Ritholtz regarding the folly $10,000 or even $3,000 gold predictions by hyperinflationists, especially when people put timeframes on them.
But not every gold fan is a hyperinflationist or an inflationist of any kind. As a staunch deflationist, as well as someone who is definitely not agnostic regarding gold, I am proof enough.
And who is it now that is coming out of the woodwork to dance on the grave of gold? It's a Plague of Gold Bears Now Say "Gold Unsafe at Any Price".
What's the Real Long-Term Driver for Gold? Click on the preceding "Plague of Gold Bears" link to find out.
We are firmly convinced that the fundamental argument in favor of gold remains intact. There exists no back-test for the current era of finance. Never before have such enormous monetary policy experiments taken place on a global basis. If there was ever a time when monetary insurance was needed, it is today.
Gold is the only liquid investment asset that neither involves a liability nor a creditor relationship. It is the only international means of payment independent of governments, and has survived every war and national bankruptcy. Its monetary importance, which has established and manifested itself in the course of the past several centuries, is in the process of being rediscovered.
Contrary to 1979/1980, the current gold bull market will unlikely end due to a sudden strong rise in interest rates, as the balance sheets of governments, households and corporations are tainted by huge debt. In the current environment, this would lead to a deflationary depression. According to the BIS, the combined debt burden of governments, households and non-financial corporations in the 18 OECD core countries has risen from 160% of GDP in 1980 to 340% of GDP in 2012.
In order to counter the current problems in the financial sector, but also in the real economy, the Fed, the Bank of Japan, the Bank of England and the ECB are going to continue to hold interest rates at a low level. There has always been a strong link between negative real interest rates and the gold price.
Monday, July 1, 2013
The New York Times had the definitive take on the vicious sell off in gold (Now and Then)
The New York Times had the definitive take on the vicious sell off in gold. To summarize one of their articles:
Two
years ago gold bugs ran wild as the price of gold rose nearly six
times. But since cresting two years ago it has steadily declined, almost
by half, putting the gold bugs in flight. The most recent advisory
from a leading Wall Street firm suggests that the price will continue to
drift downward, and may ultimately settle 40% below current levels.
The
rout says a lot about consumer confidence in the worldwide recovery.
The sharply reduced rates of inflation combined with resurgence of
other, more economically productive investments, such as stocks, real
estate, and bank savings have combined to eliminate gold's allure.
This
analysis provides a good representation of the current conventional
wisdom. The only twist here is that the article from which this summary
is derived appeared in the August 29, 1976 edition of The New York
Times. At that time gold was preparing to embark on an historic rally
that would push it up more than 700% a little over three years later. Is
it possible that the history is about to repeat itself?
Sunday, June 30, 2013
The Case for Buying Precious Metals : sell euphoria and buy hysteria.
http://www.marketanthropology.com/2013/06/the-case-for-precious-metals.html
 In
a financial era defined by a more visible hand of the central banks,
asset classes are bouncing with great frequency between the emotional
poles of euphoria and gloom. As
our work tends to focus on what lies ahead based on what has come
before - the recent historical narrative has provided prescient context
and analogy for previous asset movements echoing current market
behaviors.
In
a financial era defined by a more visible hand of the central banks,
asset classes are bouncing with great frequency between the emotional
poles of euphoria and gloom. As
our work tends to focus on what lies ahead based on what has come
before - the recent historical narrative has provided prescient context
and analogy for previous asset movements echoing current market
behaviors.
From our perspective, climate change is here - and appears to have brought all the trauma and collateral damages we routinely find within our own backyards these days.
Over the past two years we have read countless research reports, both from technical and fundamental perspectives, advocating positions in the precious metals sector - specifically, their underperforming miners. Just last December, when the XAU gold and silver index and corresponding ETF's such as GDX were twice what they currently fetch, they were heralded as great value plays by the media darlings and fast money crowd eager to catch the next wave.
Thankfully, we took a less than favorable opinion on them as well as their denominating backdrops and rightfully saw them as the enormous value traps (see Here) they quickly became this past year.
Today, as the sentiment pendulum within the sector has accelerated with great inertia towards the depressive side of the continuum, those same advocates who recommended positions at less than favorable valuations and vulnerable technical underpinnings have suffered such emotional and monetary duress, that they simply don't want any part of them and see further weakness on the horizon.
If it wasn't so predictably tragic - it would almost be funny.
While we recognize our opinion and posture for the sector has pivoted before the prevailing winds have materially shifted (see Here), this is typically the case for us - considering our process tends to be proactive towards major pivots and our timeframes old fashioned. For us, timing is a relative phrase as buying and selling into market extremes is one of the few occasions where dexterity doesn't count for much - assuming you are positioned on the right side of the tracks and are not day trading. While we can appreciate a quick day trade as much as the next guy, we've always found our most profitable ideas have horizons a bit longer than the average news cycle. This was the case for us in April of 2011 with silver's blatant parabolic top, and believe the same execution methodology and perspective will work on the dark side of exhaustion with a clear waterfall structure now in place. Keeping it simple - sell euphoria and buy hysteria. Certainly easier said than done, but if you step back from the emotional undercurrents that have drowned countless participants over the past two years, the structures left behind in the charts are all too obvious.
Moving further down the road to the bear den we once inhabited, we see that the Nouriel Roubini's of world are likely following the same fallacies they applied towards downside targets in the equity markets in 2009, in extrapolating the culmination and capitulation of positions in precious metals - likely at or near the bottom. Far from absurd, we can recognize aspects of their logic in seeing spot prices significantly below where they currently reside. As example, we had up until recently expected the bear market in metals to extend far into 2014.
What changed for us?
1. Market structure and momentum went from a gradual and erosive decline - to a full waterfall cascade.
2. Ratio expressions for the sector have extended beyond historical extremes.
3. Both the currency and interest rate backdrops have shifted.
A. We have a less favorable opinion on the US dollar; &
B. Interest rates have spiked - relieving yield differentials unfavorably impacting the sector.
4. Anecdotal evidence of prominent gold bulls capitulating and despondent conditions within the sector.

As
evident below, the value trap comparative that we have worked with this
year for guidance as to how far the miners could fall relative to gold
has fulfilled its proportional equivalent with the banks "generational
low", circa 2009. Outside of the comparative, the correlation
relationship with the banks is following the previous cycle pivot in
2000, where the banks relative to the SPX washed out before the miners
relative to gold bottomed.
Despite marching to different rhythms, it has paid very well to buy both the banks and the miners when
their respective ratio expressions (now flipped) have reached parabolic
extremes. As noted in the first series, they have proportionally
exhausted along similar lines. What is particularly interesting is the
miners are completing the same exhaustion parallel that the banks
navigated in the first half of 2009 - despite putting in a higher high
and higher low. It had always bothered us while we were negative and
short the sector that the miners had never strongly outperformed spot
prices during the span of the entire bull market. Historically speaking -
it was a rather large outlier. While outlandish as it seems right now -
perhaps their best days are yet to come. Considering the write downs
and efficiencies now dictated by current market conditions - lean and
mean for the next leg higher just may provide those conditions.
Back in 2011, a similar market and sentiment environment was spawned in the financial sector as the banks careened lower and tested participants moxie in the shadow of the financial crisis. As we recall, the general sentiment at the time - both within the trading and the pundit class, turned overtly bearish on the banks just as they were completing their cycle lows. The thought of buying Bank of America and Citigroup for anything more than a quick trade was seen as reckless and foolish by analysts and pundits so keen on extrapolating current market conditions forward. From a purely psychological perspective, the retest is often as difficult to navigate and appraise as the initial crisis itself - due to the long tails of the recency effect.
In terms of market structure and momentum, the parallels are evident in the symmetrical and positive divergent nature of their RSI fingerprints and the deeper imprints they recorded versus even during the crisis lows in 2009.
Similar to the equity indexes in 2011, gold and silver have now retraced all of their gains recorded subsequent to QE2.
Like
the financials in 2011, the more emotionally traded miners have
exhibited disproportional losses to their denominating asset class. Our
expectations - and similar to the financials circa October 2011, is once
the retest is successfully completed, the miners will once again lead
the sector higher.
The Case for Buying Precious Metals

From our perspective, climate change is here - and appears to have brought all the trauma and collateral damages we routinely find within our own backyards these days.
Over the past two years we have read countless research reports, both from technical and fundamental perspectives, advocating positions in the precious metals sector - specifically, their underperforming miners. Just last December, when the XAU gold and silver index and corresponding ETF's such as GDX were twice what they currently fetch, they were heralded as great value plays by the media darlings and fast money crowd eager to catch the next wave.
Thankfully, we took a less than favorable opinion on them as well as their denominating backdrops and rightfully saw them as the enormous value traps (see Here) they quickly became this past year.
Today, as the sentiment pendulum within the sector has accelerated with great inertia towards the depressive side of the continuum, those same advocates who recommended positions at less than favorable valuations and vulnerable technical underpinnings have suffered such emotional and monetary duress, that they simply don't want any part of them and see further weakness on the horizon.
If it wasn't so predictably tragic - it would almost be funny.
While we recognize our opinion and posture for the sector has pivoted before the prevailing winds have materially shifted (see Here), this is typically the case for us - considering our process tends to be proactive towards major pivots and our timeframes old fashioned. For us, timing is a relative phrase as buying and selling into market extremes is one of the few occasions where dexterity doesn't count for much - assuming you are positioned on the right side of the tracks and are not day trading. While we can appreciate a quick day trade as much as the next guy, we've always found our most profitable ideas have horizons a bit longer than the average news cycle. This was the case for us in April of 2011 with silver's blatant parabolic top, and believe the same execution methodology and perspective will work on the dark side of exhaustion with a clear waterfall structure now in place. Keeping it simple - sell euphoria and buy hysteria. Certainly easier said than done, but if you step back from the emotional undercurrents that have drowned countless participants over the past two years, the structures left behind in the charts are all too obvious.
Moving further down the road to the bear den we once inhabited, we see that the Nouriel Roubini's of world are likely following the same fallacies they applied towards downside targets in the equity markets in 2009, in extrapolating the culmination and capitulation of positions in precious metals - likely at or near the bottom. Far from absurd, we can recognize aspects of their logic in seeing spot prices significantly below where they currently reside. As example, we had up until recently expected the bear market in metals to extend far into 2014.
What changed for us?
1. Market structure and momentum went from a gradual and erosive decline - to a full waterfall cascade.
2. Ratio expressions for the sector have extended beyond historical extremes.
3. Both the currency and interest rate backdrops have shifted.
A. We have a less favorable opinion on the US dollar; &
B. Interest rates have spiked - relieving yield differentials unfavorably impacting the sector.
4. Anecdotal evidence of prominent gold bulls capitulating and despondent conditions within the sector.
- Ratio Extreme
 |
| Click to enlarge image |
 |
| Click to enlarge image |
 |
| Click to enlarge image |
- The Retest & QE2 Retracement
Back in 2011, a similar market and sentiment environment was spawned in the financial sector as the banks careened lower and tested participants moxie in the shadow of the financial crisis. As we recall, the general sentiment at the time - both within the trading and the pundit class, turned overtly bearish on the banks just as they were completing their cycle lows. The thought of buying Bank of America and Citigroup for anything more than a quick trade was seen as reckless and foolish by analysts and pundits so keen on extrapolating current market conditions forward. From a purely psychological perspective, the retest is often as difficult to navigate and appraise as the initial crisis itself - due to the long tails of the recency effect.
In terms of market structure and momentum, the parallels are evident in the symmetrical and positive divergent nature of their RSI fingerprints and the deeper imprints they recorded versus even during the crisis lows in 2009.
 |
| Click to enlarge image |
For the broad equity indexes, the cascade in 2011 marked a complete retracement of gains recorded in QE2.
 |
| Click to enlarge image |
 |
| Click to enlarge image |
 |
| Click to enlarge image |
 |
| Click to enlarge image |
- Patterns & Fractals
 |
| Click to enlarge image |
 |
| Click to enlarge image |
 |
| Click to enlarge image |
 |
| Click to enlarge image |
 |
| Click to enlarge image |
 |
| Click to enlarge image |
 |
| Click to enlarge image |
Thursday, June 27, 2013
The Adjusted Gold/XAU Ratio as an Indicator of Forward Returns for Gold Stocks
http://www.advisorperspectives.com/newsletters12/19-adjgold.php
The Adjusted Gold/XAU Ratio as an Indicator of Forward Returns for Gold Stocks – An Update
urrently the gold/XAU ratio is below the extension of the trend line. If the blue trend line is indeed an indicator for peaks in the ratio, then we can expect such a peak to occur soon. Extending the current trend of the adjusted ratio, as represented by the short green line, we can anticipate intersection with the blue line at a level of about 11.4, which would indicate the expected peak level of the gold/XAU ratio. An increase in the price of gold with XAU gaining relatively less – or, alternatively, a further decline of XAU with gold remaining at the current price – could lead to the anticipated peak level. Once the trend-adjusted ratio has formed a peak and starts to decline, one can reasonably expect good gains for gold stocks afterwards, as has always been the case in the past. Those prior examples are listed in Table 1.

Table 1
The recent gold/XAU ratio and historic returns for XAU
As mentioned in my October 2011 article, one could have, based on the then-prevailing gold/XAU ratio of about 8.30, expected significant gains for XAU over the subsequent eight months. That time has almost passed, and XAU has instead lost value since then.
In order for XAU to gain, the gold/XAU ratio would have had to get lower and stay below the criterion value of 8.30 during the remainder of the stipulated investment period, or the extended investment period, as explained in the original article. Since the ratio never fell below 8.30 and is now about 10.5, the investment period is not complete, and thus a final determination cannot be made on whether the investment strategy was successful or not.
But what performance can we expect from gold stocks in the near future? Looking back we see that there were only two other occasions when the adjusted ratio was as high as the current level, namely in 1980 and 2008. The returns that followed on those occasions when the adjusted ratio was 10.0 are shown in the table below.
Table 2
If history repeats itself, then substantial returns await investors in gold equities – and they may be realized fairly soon.
The Adjusted Gold/XAU Ratio as an Indicator of Forward Returns for Gold Stocks – An Update
urrently the gold/XAU ratio is below the extension of the trend line. If the blue trend line is indeed an indicator for peaks in the ratio, then we can expect such a peak to occur soon. Extending the current trend of the adjusted ratio, as represented by the short green line, we can anticipate intersection with the blue line at a level of about 11.4, which would indicate the expected peak level of the gold/XAU ratio. An increase in the price of gold with XAU gaining relatively less – or, alternatively, a further decline of XAU with gold remaining at the current price – could lead to the anticipated peak level. Once the trend-adjusted ratio has formed a peak and starts to decline, one can reasonably expect good gains for gold stocks afterwards, as has always been the case in the past. Those prior examples are listed in Table 1.
Table 1
date when peak of adjusted gold/XAU occurred
|
level of XAU at peak of adjusted gold/XAU
|
date when XAU gained most after peak of adjusted gold/XAU
|
max XAU after peak of adjusted gold/XAU
|
%-gain
|
annualized rate of return
|
1/21/1980
|
105.24
|
10/1/1980
|
183.59
|
74%
|
122%
|
7/15/1982
|
52.8
|
1/5/1983
|
150.11
|
184%
|
795%
|
7/30/1986
|
60.04
|
9/9/1987
|
155.74
|
159%
|
136%
|
11/30/1992
|
65.81
|
1/6/1994
|
145.57
|
121%
|
106%
|
11/20/2000
|
42.17
|
3/5/2008
|
206.37
|
389%
|
24%
|
10/28/2008
|
72.72
|
3/30/2011
|
228.95
|
215%
|
61%
|
The recent gold/XAU ratio and historic returns for XAU
As mentioned in my October 2011 article, one could have, based on the then-prevailing gold/XAU ratio of about 8.30, expected significant gains for XAU over the subsequent eight months. That time has almost passed, and XAU has instead lost value since then.
In order for XAU to gain, the gold/XAU ratio would have had to get lower and stay below the criterion value of 8.30 during the remainder of the stipulated investment period, or the extended investment period, as explained in the original article. Since the ratio never fell below 8.30 and is now about 10.5, the investment period is not complete, and thus a final determination cannot be made on whether the investment strategy was successful or not.
But what performance can we expect from gold stocks in the near future? Looking back we see that there were only two other occasions when the adjusted ratio was as high as the current level, namely in 1980 and 2008. The returns that followed on those occasions when the adjusted ratio was 10.0 are shown in the table below.
Table 2
Historic XAU Returns for Criteria Value of Adjusted Gold/XAU = 10.0
and minimum investment period of 180 days |
||||||
Investment Period from - to
|
XAU value at start
$ |
XAU value at end
$ |
no. of months in each period
|
absolute return for each period
|
gain
(loss) over period $ |
|
1/3/80
|
10/6/80
|
79.5
|
178.0
|
9.1
|
123.8%
|
98.5
|
10/22/08
|
5/16/09
|
71.7
|
136.7
|
6.8
|
90.7%
|
65.0
|
4/11/12
|
-
|
164.3
|
-
|
-
|
-
|
-
|
If history repeats itself, then substantial returns await investors in gold equities – and they may be realized fairly soon.
Subscribe to:
Posts (Atom)