If there is one fatal siren’s song of investing, it
is the belief that an unfinished half of the market cycle will remain
unfinished. A typical, run-of-the-mill market cycle runs about 5 years
in duration (though with a significant amount of individual variation).
The typical bull market portion extends about 3.75 years, on average,
during which time stocks advance at an annual rate of about 28%. The
typical bear market portion extends about 1.25 years, on average,
during which time stocks decline at an annual rate also about 28%.
Historically, that puts the typical bull market gain at about 152% from
trough-to-peak, followed by a bear market decline about 34% from
peak-to-trough, for a cumulative full-cycle total return of about 67%
(roughly 10.7% annualized). Taking the arithmetic average of past bull
market declines (a slightly different calculation), the typical bear
market comes in closer to a 32% decline. In any event, notice that even
a run-of-the-mill bear market decline wipes out more than half of the preceding bull market advance.
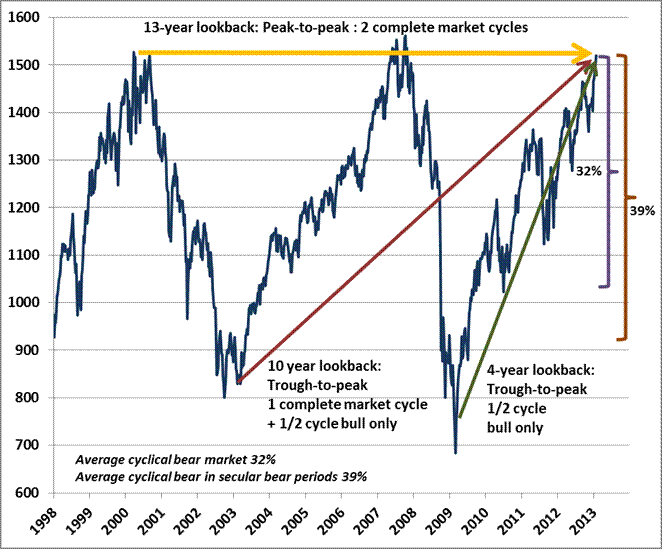
To put some perspective of where the market stands
at present, and why the siren’s song of the unfinished half-cycle is
so dangerous here, the chart below presents the S&P 500 since 1998.
Notice in particular that the apparent performance of the market is
strikingly different depending on the “lookback” that investors use.
The 10-year lookback and the 4-year lookback are particularly
misleading because each captures an unfinished half-cycle; essentially a
trough-to-peak market move. Such lookbacks are useful only on the
assumption that the preceding bear market periods were entirely avoided,
and that the next one will be avoided as well. Otherwise, lookbacks
with less heroic assumptions (e.g. peak-to-peak across market cycles)
are more reasonable.

The chart above features two brackets. The first
shows depicts a run-of-the-mill market decline of 32%, which is the
historical average of how market cycles are completed. Such a
decline would wipe out more than half of the recent bull market
advance. The second bracket depicts a 39% bear market decline, which is
the historical average for cyclical bear markets that take place within secular bear market periods.
No comments:
Post a Comment