DA NANG – The twin impacts of the worst global health pandemic in over a century and a price war standoff between the world’s top oil producers Saudi Arabia and Russia has driven oil prices to record lows that could soon fall into single dollar digits per barrel.
On March 30, spot prices for both global benchmark Brent crude and US-benchmark West Texas Intermediate (WTI) fell to levels not seen since 2002. Brent was trading around $23 per barrel while WTI sank briefly below the psychologically important $20 per barrel price point.
Within 24 hours of trading prices had recovered slightly, with Brent up 38 cents per barrel and WTI up 79 cents, but more dips are expected before substantial rises. Single dollar digit oil prices, not seen in decades, now seem a distinct market possibility, analysts say.
Prices for Brent and WTI have tanked by more than 50% in the past two weeks, thanks to the double whammy of the Covid-19 pandemic and Riyadh versus Moscow stand-off over oil production levels.
The market has now flipped dramatically from “backwardation”, where the forward price of oil futures contracts is lower than the prevailing market price, to “contango”, where the opposite price relationship holds.
That trend has not been seen in decades, underscoring the uncharted waters oil markets have entered with prices down more than 65% since the start of the year.
The downward drivers for oil prices are excess production, demand destruction and a corresponding buildup of inventory levels. The Oxford Institute for Energy Studies said last week that concern about the availability of storage will continue to put severe pressure on prices.
The economic impact of the Covid-19 pandemic and its effect on future oil demand is being forecasted variously, to say the least.
Consultancy Rystad Energy said in a March 30 note that around 16 million barrels per day (bpd) of oil demand will be lost in April, while oil supply chains are being broken due to “unbelievably large losses in oil demand, forcing all available alternatives of supply chain adjustments to take place during April and May.”
“We see in this coming month of April what could be a 20 million bpd decline in oil demand. It’s unprecedented,” Dan Yergin of IHS Markit told CNBC on March 30. “That’s six times larger than the biggest downturn during the [2008-9] financial crisis period,” he added.
However, while the problem of oil demand destruction due to the Covid-19 pandemic will likely take months or even longer to play out, the impact of the oil price war between Riyadh and Moscow will be felt more than originally anticipated.
As global oil storage capacity fills up, including on emergency floating facilities, the lack of storage will backfire on the Saudis and Russians, as both opportunistically seek to lock in and steal market share from one another by cranking up their oil production spigots.
Global oil demand is collapsing due to the Covid-19 pandemic. Photo: AFP
Analysts say there will soon be nowhere to store all of the extra production that both countries are producing. This will inevitably lead to production closure, a rare occurrence in global oil markets that are usually clamoring for more of the precious black commodity.
As production closures ensue and economic activity ideally picks up as the Covid-19 pandemic eventually eases, markets could return to some form of price sanity and market equilibrium, with a new price floor that could help many producers shore up their balance sheets and plan ahead.
Under one scenario prices will return to the $30s and possibly the low $40s by late this year. WTI future are expected to trade at an average of $34.95 per barrel in 2020, The Wall Street Journal said yesterday, citing a poll of 11 major banks.
The banks also forecast that Brent crude will average $38.12 per barrel this year, its lowest price point since 2004. For the second quarter, however, Brent is expected to stay below $28 per barrel and WTI below $25, the same poll showed.
Though these forecasts show a rise in prices from their current levels, they are still too low for Saudi Arabia and Russia to even come close to their so-called fiscal break even points, the price that oil needs to reach for the two to balance their books.
Saudi Arabia, for its part, needs oil at a whopping $85 per barrel to balance the its national fiscal accounts, according to the International Monetary fund (IMF), while Russia needs prices in at least the mid $40s.
An oil pump jack is pictured at the Abino-Ukrainian oil and gas field in the Krasnodar region, Russia. Photo: AFP Forum via Sputnik/Vitaly Timkiv
Russia may be able to endure this prolonged low price environment longer than Saudi Arabia, which could be forced to raise cash through international bond sales to say afloat.
But for the foreseeable future raising cash when at least one third of the world is under lockdown and the global economy headed into what could be a multi-year recession seems a fool’s errand at best.
Moreover, the hit to Saudi coffers may be a blow that could take years to overcome, just as the country was supposedly trying to wean itself off of oil revenues for economic sustenance.
With many speculating who will blink first in the Saudi-Russian oil price struggle, it seems increasingly that the Saudis will fold first.
However, the question has changed from who will blink first to whom will be hit the hardest. The answer: US shale and other oil producers.
The resurgence of US oil production over the past decade, enabled by the wonders of fracking and hydraulic drilling, has revolutionized global oil markets and transformed the US into the top global producer.
That has allowed the US to grab market share from entrenched global oil as well as gas producers. However, America’s brief two-year reign at the top of the global oil production hierarchy could soon end.
Edward Bell, commodities analyst at Dubai-based bank Emirates NBD, said that the current rate of rig closures in the US means caused by falling prices will lead to an estimated 750,000 bpd decline from the second quarter onward.
A US oil refinery facility in a file photo. Photo: iStock/Getty Images
That, he says, will drive US output of around 13 million bpd at the start of the year to “down below Saudi Arabia or Russia by the end of the year.”
The implications for the US are multi-faceted, ranging from a painful economic downturn in the country’s until recently vibrant energy sector, with a ripple effect through the overall economy, to massive oil industry layoffs.
Those, in turn, will lead to the probable reorganization and insolvency of several US oil and gas companies, especially smaller players that were already burning cash on their balance sheets to stay operational.
On a larger scale, it will also mean a loss of the recently recouped geo-political power the US has enjoyed from ramped up oil production. Small wonder, then, that US officials are publicly calling on Russian and Saudi leaders to stop their supply war and allow prices to start floating upwards again
“It says something about sentiment that some retail traders (erroneously) believe they have discovered a market loophole whereby philosophically the only limiting constraint on their success is the degree of their own conviction and willingness to act upon it (by buying calls.)” This was how Luke Kawa concluded his piece in Bloomberg’s “5 Things” newsletter on Tuesday and I believe it does a terrific job of encapsulating the zeitgeist in the stock market today.
Many have asked, ‘What in the world is driving stock prices higher today while earnings have been falling for the past year, stock buybacks are dwindling, signs of recession are popping up everywhere, an epidemic looks be evolving into a pandemic and the end of the Fed’s greatest liquidity injection of all time is in sight?’
The answer is the same thing that ends every speculative mania. A crescendo of euphoric buying by the uninitiated. By “euphoric buying” I simply mean leveraged speculation that will only pay off in the most extreme upward explosion and by “uninitiated” I am referring to those who have not experienced a crash in their adult lifetimes.
The evidence to the former is substantial. Google searches for the term “call options” are soaring to their highest levels on record dating back to 2004. The volume is roughly double any other peak we have seen over the past decade. Search “call options” on YouTube and the most popular video over the past week is a “how to” on buying Tesla call options, (hat tip, Grant Williams). The video’s creator divulges, “I recently, though, got into buying call options. I had no idea what these were until I had a few people on Twitter posting about them, a few people at work even.” This probably helps to explain all of the Google search activity. Clearly, retail traders like this gentleman have now “discovered a market loophole” and need Google to help them take advantage of it.
To understand the extent to which these call options trades are now moving the market, Goldman Sachs found, the notional volume of single stock options traded as a percent of the notional volume of shares traded recently rose to 91%, a new record high. In other words, the activity in call options now rivals the amount of trading in the actual stocks themselves. The difference here is that there is a market maker on the other side of an options trade who must hedge his exposure. Because he’s short a call he must go buy stock in the open market roughly equivalent to the notional value of the option.
Therefore, this leveraged speculation in options is allowing a group of traders with far less capital than would otherwise be required to move markets of this size to move the market. Why is Microsoft seeing its stock price go parabolic? Why is Tesla? Why is Shopify? In addition to record inflows into tech funds and their overweight exposure in uber-popular ESG funds, it is due to thousands of amateur options traders buying call options forcing market makers to buy the common. And as stock prices go up, market makers are forced to buy even more resulting in a virtuous cycle.
To further put an exclamation point on just how prevalent this speculative activity has become, Jason Goepfert, of SentimenTrader, last week noted that the explosion in activity among retail traders is totally unprecedented. eTrade DARTs, or Daily Active Revenue Trades, also just soared to new record highs, nearly 50% greater than the high we saw in early-2018 which led into the “volmageddon” mini-crash.
All of this panic buying among retail traders, especially concentrated in the options market, has helped to push the SKEW Index to its highest level since August of 2018, just prior to the waterfall decline in the broad stock market later that year. Known more familiarly as the “Black Swan Index”, SKEW is published by the CBOE as an indicator of “tail risk” in the market. The Wall Street Journal reported last week on the implications of such a high reading:
Far from indicating a widespread worry about a Black Swan event, she [Jessica Wachter, a finance professor at the Wharton School] says, it probably signified that the consensus among traders had become significantly more optimistic. The reason for this, Prof. Wachter says, is that a high SKEW reading in essence means that there is a significant pocket of aggressive bearishness that is far outside the range of opinions among everyone else. She points out that a rising SKEW reading therefore doesn’t automatically mean that any erstwhile bulls have become aggressively bearish. It instead could indicate that the mainstream consensus has become significantly more bullish.
This idea that the consensus has become significantly more bullish is validated not just by the rampant call activity noted above. It is also represented by the fact that the stock market is now only factoring in a 2% chance of recession this year even as most economists assess it to be 25% and a quantitative model developed by researchers at MIT and based on the trends in industrial production, non-farm payrolls, stock market returns and the slope of the yield curve puts it at 70%.
Confirming the more bearish reading from the guys and gals at MIT was the job openings number that was reported last week. December saw total non-farm job openings fall to 6,423,000 from 6,787,000 in November and 7,625,000 in December of 2018, amounting to an annual decline of 14%. As Julien Bittel pointed out on twitter, the last time this number fell by this amount year-over-year was 2008, when we were entering the throes of the Great Financial Crisis. Meanwhile, as Julien points out, the stock market is discounting a gain in job openings of more than 20%.
Remember that this is all before news of the Wu Flu, Coronavirus, Covid-19 or whatever you choose to call it really began to take off. As the New York Times put it, “Several key markets — like crude oil — had already been showing softness, suggesting that the global economy was weak even before the virus hit.” One of those key markets or indicators is the state of global commerce. The Wall Street Journal reported, “Growth in global trade sank to a meager 1% last year, down from 4% in 2018 and 6% in 2017. It was the fourth worst showing in 40 years, and the worst ever outside a period of recession, according to International Monetary Fund data.” Considering China is essentially closed for business right now, it’s hard to see how this already recessionary number will not deteriorate even further, possibly in dramatic fashion.
Still, the stock market is clearly operating under the assumption that any slowdown in the first quarter will be followed by a v-bottom and a rapid rebound in the second and third quarters. Analysts thus feel confident in “looking through” the weakness that might materialize as a result of the first epidemic in nearly two decades. But I would tend to agree with WSJ’s Justin Lahart who warned, “Beware of Wall Street’s Armchair Epidemiologists.” China has been reporting a steady rise in Wu Flu cases since it first was announced and it looks to some to be too steady. Ben Hunt wrote last week:
All epidemics – before they are brought under control – take the form of… an exponential function of some sort. It is impossible for them to take the form of… a quadratic or even cubic function of some sort. This is what the R-0 metric of basic reproduction rate means, and if – as the WHO has been telling us from the outset – the nCov2019 R-0 is >2, then the propagation rate must be described by a pretty steep exponential curve. As the kids would say, it’s just math.
China would have us believe the impossible. But even the White House is now calling the data into question. Edward Lawrence, Fox Business correspondent, tweeted, “Administration sources say they believe China is under reporting the number of Coronavirus cases by at least 100,000 in China. Also sources say the administration believes China is ‘severely’ under reporting the number of deaths from the virus.” A Nowcasting estimate published in The Lancet confirms these findings.
In stark contrast to Wall Street’s armchair epidemiologists, real ones are coming to a far bleaker conclusion. Marc Lipsitch, professor of epidemiology at the Harvard T.H. Chan School of Public Health and head of the School’s Center for Communicable Disease Dynamics, told the Harvard Gazette, that rather than seeing a peak in the number of new cases, “I think it’s more likely to be that it’s gathering steam.” He went on, “There’s likely to be a period of widespread transmission in the U.S…. I think we should be prepared for the equivalent of a very, very bad flu season, or maybe the worst-ever flu season in modern times.” Another expert with even more direct experience with the virus sees the situation as even more dire. Bloomberg reported:
As the number of coronavirus cases jumps dramatically in China, a top infectious-disease scientist warns that things could get far worse: Two-thirds of the world’s population could catch it. So says Ira Longini, an adviser to the World Health Organization who tracked studies of the virus’s transmissibility in China. His estimate implies that there could eventually be billions more infections than the current official tally of about 60,000.
This stands in stark contrast to the assumptions being made by those whose livelihood depends on them not understanding it, to botch the Upton Sinclair quote. Stock prices at record highs and, more importantly, record high valuations have clearly embodied Alfred E. Neuman’s catch phrase, “What, me worry?” In the face of some the of the greatest risks to the economy and bull market we have seen in at least a decade and possibly ever, investors are reaching for risk in ways they have never done before. It is so dichotomous it’s almost impossible to believe. Truth is stranger than fiction, as they say.
As difficult as it may be to explain, Mark Spitznagel described it thus: “When the stock market is no longer tethered to fundamentals—that’s the distorted environment we live in, that’s just where we are—when that happens, any price can print. Any price can print. We shouldn’t be surprised by anything on the upside at this point because what’s tethering the markets?” What, indeed?
Then again, while the stock market may be a voting machine in the short run, it is, and will always be, a weighing machine in the long run, to paraphrase Ben Graham. And when the market is forced to weigh the risks that are already growing in both probability and severity the uninitiated will be initiated and a stock market crash will ensue. And while some now believe that day of reckoning will never come because the Fed is capable of forestalling recession indefinitely, they may soon be forced to ask whether the Fed can forestall an epidemic that could potentially rival the Spanish flu.
Jerome Powell recently admitted that the Fed’s tools in dealing with another recession are limited at best. Still, investors believe otherwise. But it’s hard to imagine the psychological jiu jitsu required to believe a room full of academics with expertise limited to the “dismal science” and tools relegated to the monetary system to solve a global health crisis. Yet, having witnessed the lengths to which the current euphoria has now extended, I wouldn’t put it past them.
Barrick reported adjusted net earnings in the three months to the end of December of $300m, or 17 cents a share, up from $264m in the third quarter. Analysts had forecast earnings of 13 cents. That allowed the Toronto-based company to declare a dividend of 7 cents a share, up from 5 cents in the third quarter. Barrick said the payout was justified by growth in free cash flow and a significant reduction in net debt, which over the course of 2019 halved to $2.2bn.
Mr Bristow said he wanted to make the gold miner attractive to generalist investors by providing a steady yield. “When you buy physical gold you don’t get a yield but if you buy a well-run sustainably run gold mining company you should get a yield,” he told the Financial Times. The world’s second-largest gold miner has benefited from a rise in gold prices to a six-year high and $1bn in asset sales following Mr Bristow’s appointment to the top job in January 2019.
Mr Bristow has said he would like to expand the gold miner’s presence in copper, highlighting the Grasberg copper and gold mine in Indonesia owned by Freeport-McMoran as an attractive asset. Shares in Barrick Gold, which is listed in Toronto and New York, have risen by 37 per cent over the past 12 months, outperforming the gold price. They were little changed on Wednesday following the results statement, trading at C$24.58.
Analysts at RBC Capital Markets said the results were slightly disappointing, noting the earnings beat reflected a lower depreciation charge and Barrick generated less cash than expected because of higher capital spending and tax charges.
“We calculate fourth quarter free cashflow of $287m, $66m below our estimate of $353m,” the analysts said. Gold production rose to 5.5m ounces of gold, from 4.5m ounces a year earlier. Net debt fell by 46 per cent in 2019 to $2.2bn, Barrick said. Barrick said that it is considering an expansion of its Pueblo Viejo mine in the Dominican Republic, which will extend its life beyond 2040 at a production rate of 800,000 ounces of gold a year.
In the good old days, America’s budget deficit yawned when the economy was weak and shrank when it was strong. It fell from 13% to 4% of gdp during Barack Obama’s presidency, as the economy recovered from the financial crisis of 2007-09. Today unemployment is at a 50-year low. Yet borrowing is rising fast. Tax cuts in 2017 and higher government spending have widened the deficit to 5.5% of gdp, according to imf data—the largest, by far, of any rich country.
It could soon widen even further. President Donald Trump is thought to want a pre-election giveaway. Fox News is awash with rumours of “Tax Cuts 2.0”. This month the Treasury announced it would issue a 20-year bond, which would lengthen the average maturity of its debt and lock in low interest rates for longer. All this is quite a change for many Republicans, who once accused Mr Obama of profligacy, but now say that trillion-dollar deficits are no big deal. Democratic presidential candidates, meanwhile, are talking about Medicare for All and a Green New Deal. A new consensus on fiscal policy has descended o


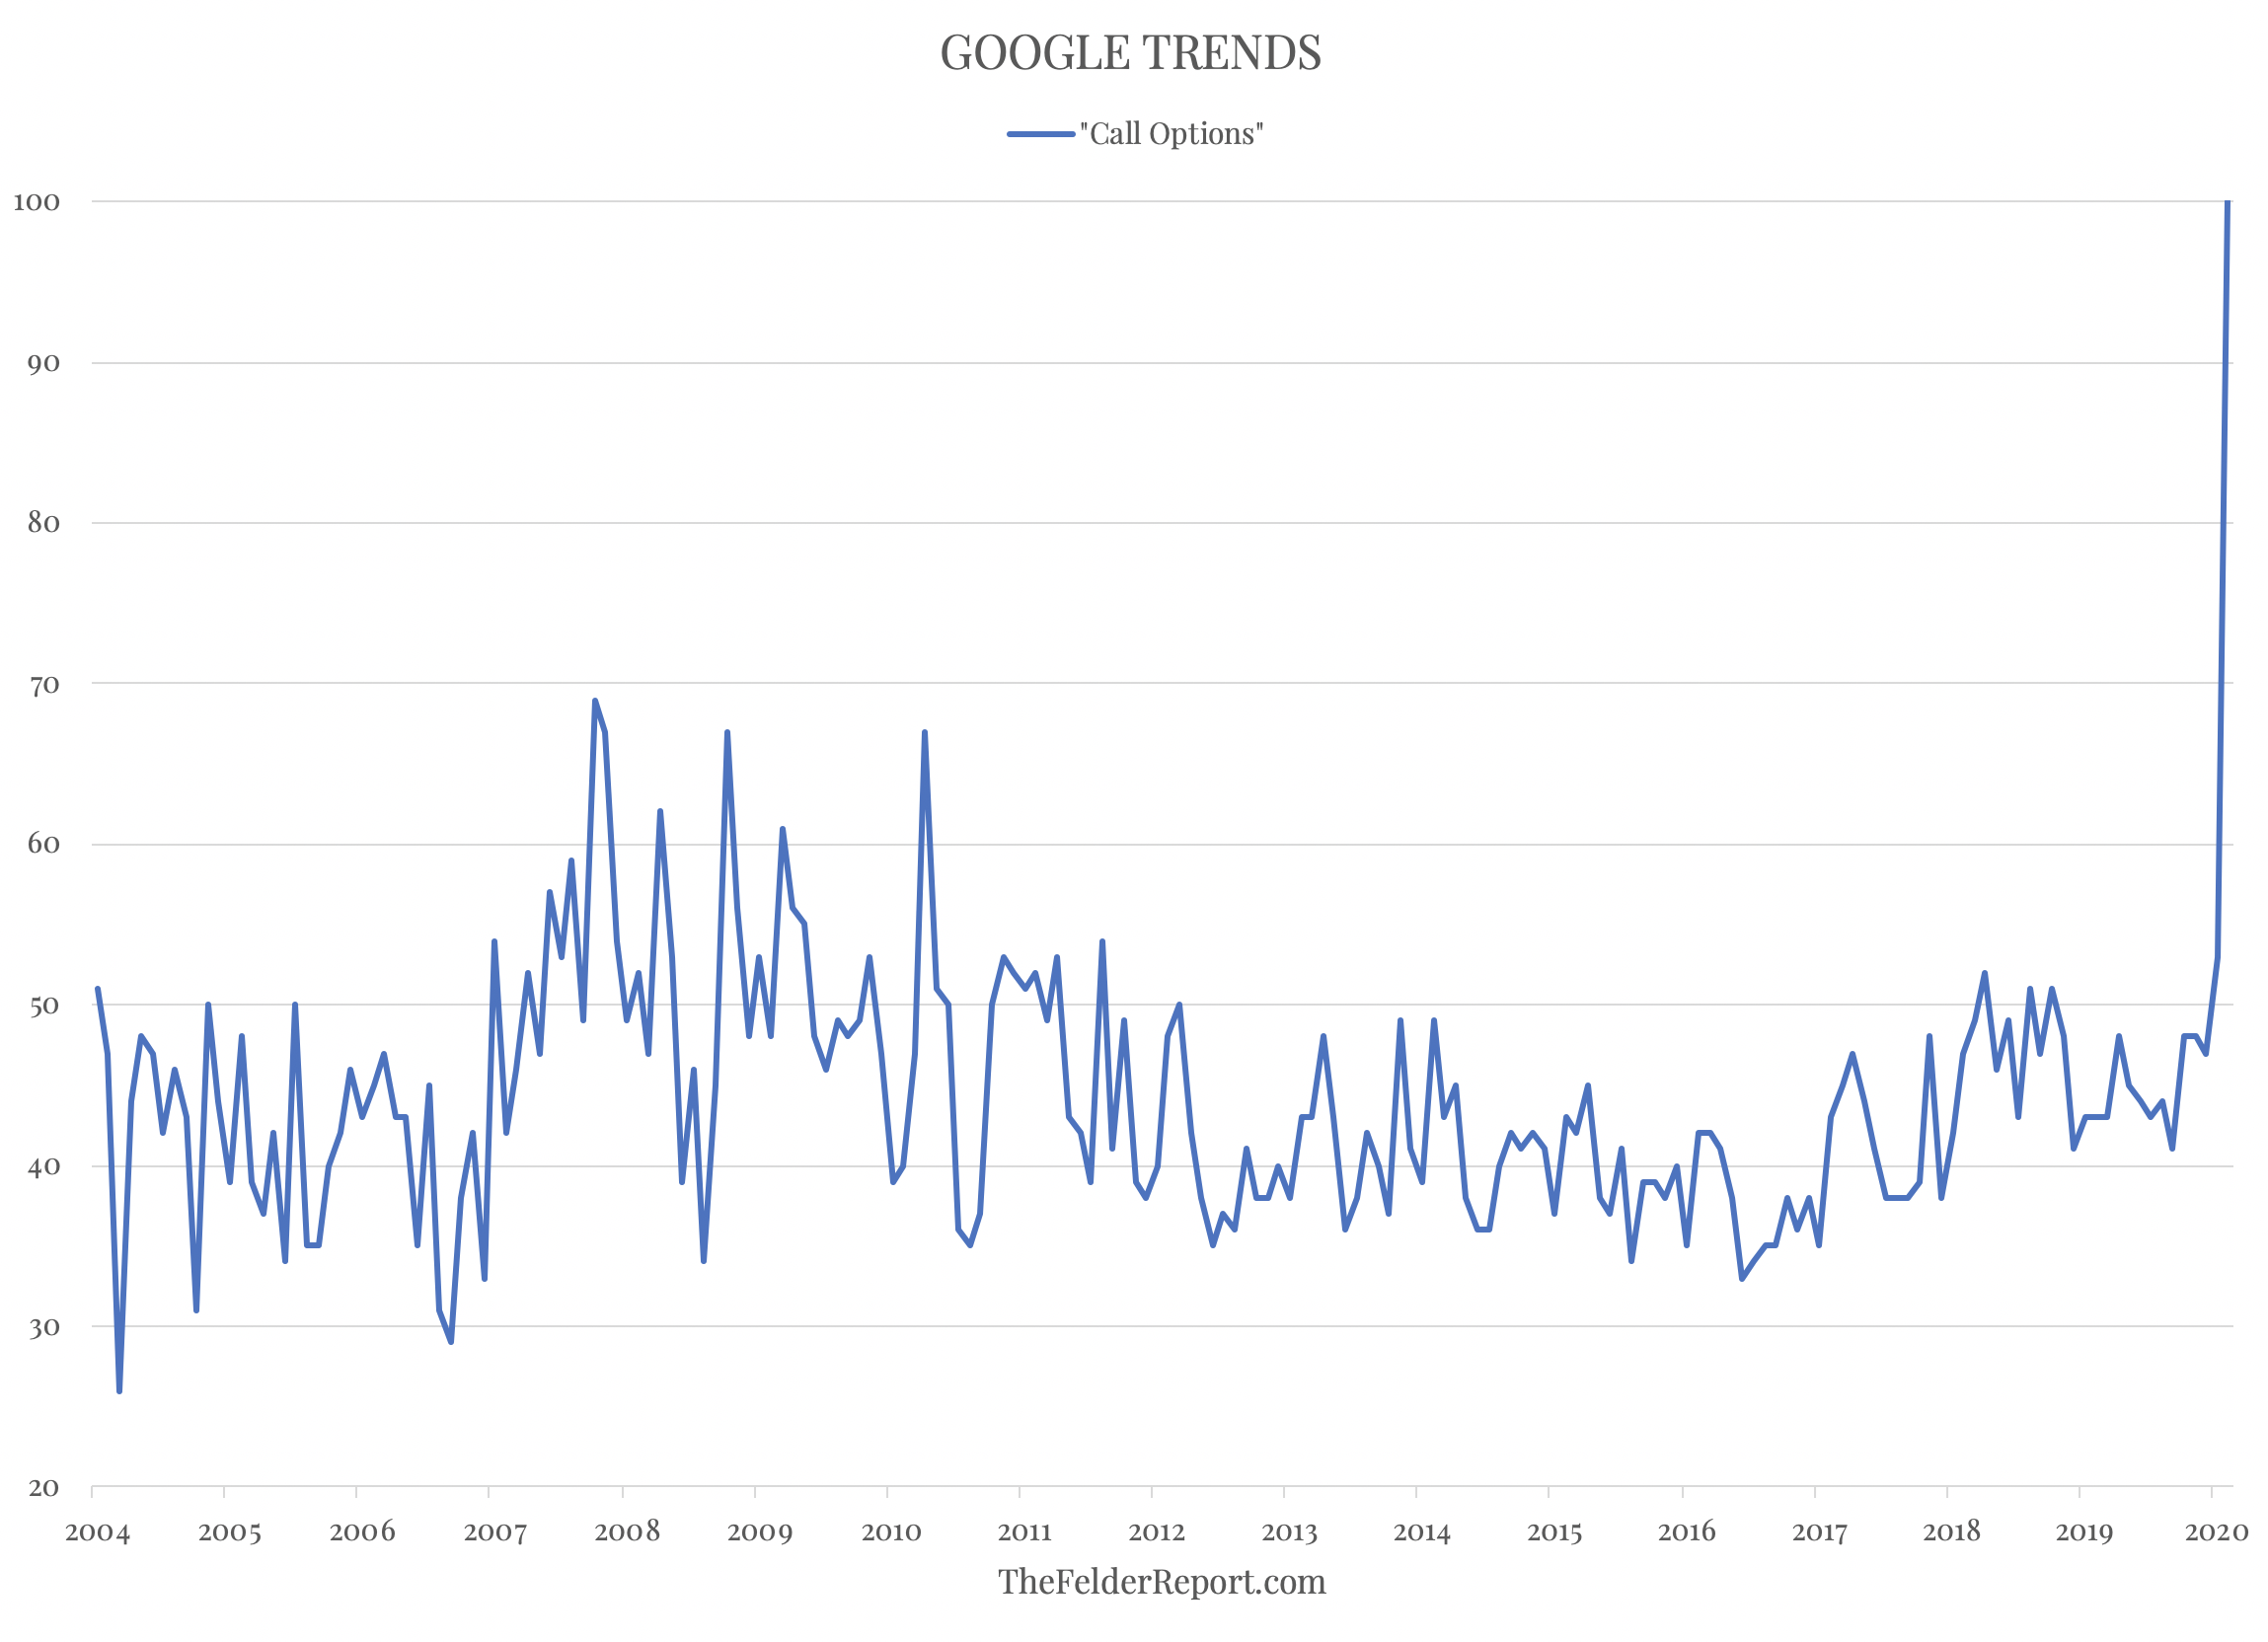 The evidence to the former is substantial. Google searches for the term “call options” are soaring to their highest levels on record dating back to 2004. The volume is roughly double any other peak we have seen over the past decade. Search “call options” on YouTube and the most popular video over the past week is a “how to” on buying Tesla call options, (hat tip, Grant Williams). The video’s creator divulges, “I recently, though, got into buying call options. I had no idea what these were until I had a few people on Twitter posting about them, a few people at work even.” This probably helps to explain all of the Google search activity. Clearly, retail traders like this gentleman have now “discovered a market loophole” and need Google to help them take advantage of it.
 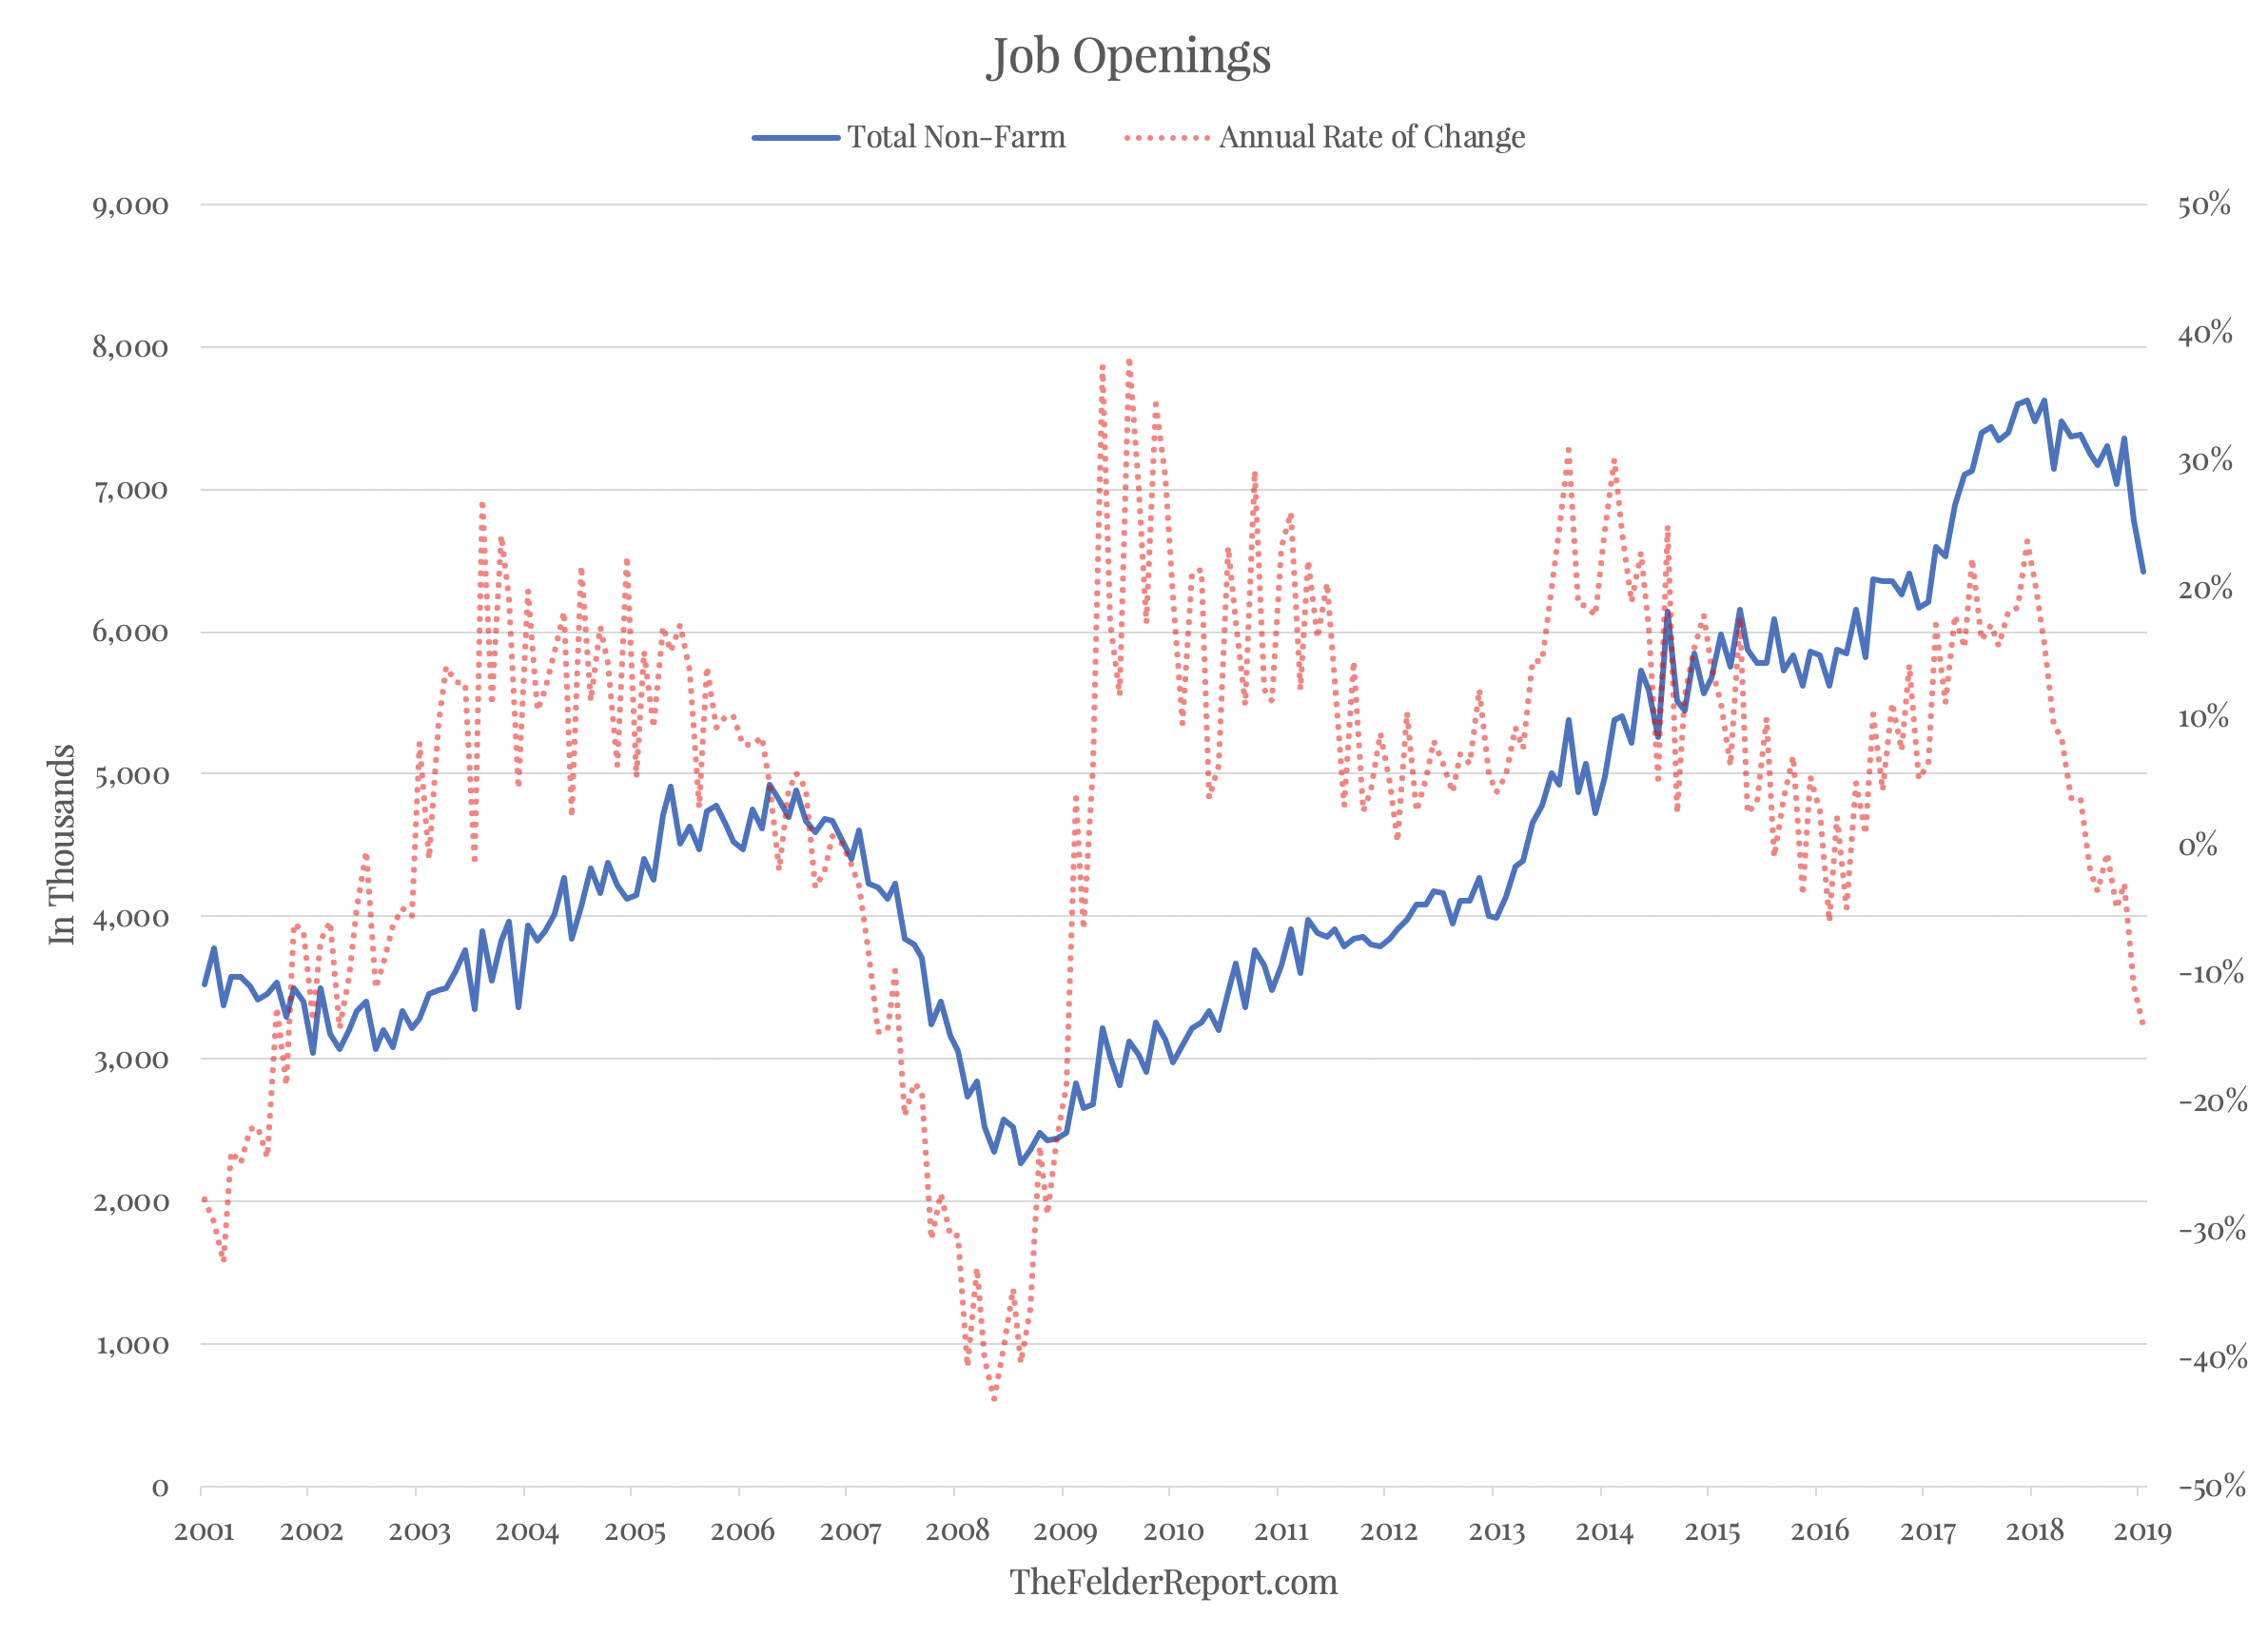 Confirming the more bearish reading from the guys and gals at MIT was the job openings number that was reported last week. December saw total non-farm job openings fall to 6,423,000 from 6,787,000 in November and 7,625,000 in December of 2018, amounting to an annual decline of 14%. As Julien Bittel pointed out on twitter, the last time this number fell by this amount year-over-year was 2008, when we were entering the throes of the Great Financial Crisis. Meanwhile, as Julien points out, the stock market is discounting a gain in job openings of more than 20%.
 In stark contrast to Wall Street’s armchair epidemiologists, real ones are coming to a far bleaker conclusion. Marc Lipsitch, professor of epidemiology at the Harvard T.H. Chan School of Public Health and head of the School’s Center for Communicable Disease Dynamics, told the Harvard Gazette, that rather than seeing a peak in the number of new cases, “I think it’s more likely to be that it’s gathering steam.” He went on, “There’s likely to be a period of widespread transmission in the U.S…. I think we should be prepared for the equivalent of a very, very bad flu season, or maybe the worst-ever flu season in modern times.” Another expert with even more direct experience with the virus sees the situation as even more dire. Bloomberg reported: