Thursday, August 23, 2018

Traders increase bets that gold has further to fall Net positioning in futures market in negative territory for first time since end of 2001

Traders increase bets that gold has further to fall

Net positioning in futures market in negative territory for first time since end of 2001
 
https://www.ft.com/content/fd4cb166-a25c-11e8-85da-eeb7a9ce36e4

 Please use the sharing tools found via the share button at the top or side of articles. Copying articles to share with others is a breach of FT.com T&Cs and Copyright Policy. Email licensing@ft.com to buy additional rights. Subscribers may share up to 10 or 20 articles per month using the gift article service. More information can be found here.
https://www.ft.com/content/fd4cb166-a25c-11e8-85da-eeb7a9ce36e4

Traders increase bets that gold has further to fall Net positioning in futures market in negative territory for first time since end of 2001 Share on Twitter (opens new window) Share on Facebook (opens new window) Share on LinkedIn (opens new window) Save to myFT Robin Wigglesworth, Joe Rennison and Gregory Meyer in New York August 17, 2018 Print this page 24 Traders have increased their bets against gold, with speculative positions in futures on the precious metal the most bearish in 17 years, according to government data released on Friday. The price of a troy ounce of gold has fallen another 3.3 per cent this month to a one-and-a-half year low of $1,182.90, extending this year’s tumble to more than 9 per cent. Although it enjoyed a bounce on Friday, fresh data from the Commodity Futures Trading Commission indicates that some investors think gold’s descent has further to go. The net positioning of “non-commercial” players in the gold futures market — a CFTC classification that includes hedge funds, asset managers and trading groups — has fallen into negative territory for the first time since the end of 2001. Gold has performed poorly as interest rates and the US dollar have risen this year, since it offers no yield and is more commonly bought as a “safe haven” when the greenback’s value is falling. The dollar has enjoyed a renaissance since this spring, thanks to the robust economy and the Federal Reserve’s rate increases, and the main US currency index hit a one-year high this week. Friday’s CFTC data also indicated that investor positioning in dollar futures is the most bullish it has been in a year. “It is all the dollar,” said Peter Boockvar, chief investment officer at Bleakley Advisory Group. At the same time, China’s economic slowdown has dented appetite for gold in Asia. “Escalating trade tensions, a slowdown in Chinese activity and continued dollar strength were the main factors driving the sharp sell-off in both base and precious metals so far,” JPMorgan’s analysts said in a note to clients on Friday. Recommended Markets Insight John Authers Why gold tells us this EM crisis is all about the dollar The CFTC’s more granular “managed money” gold futures positioning category — which is mostly made up of hedge funds — has been in negative territory since the last week of June, and fell to a record net short position of 83,000 contracts. But some investors see the CFTC data as a contrarian measure. “When you see this extreme positioning on the short side it leads to a bottom in gold . . . It’s a great sign that a gold bottom is very near,” said Mr Boockvar, a longstanding bull on gold.

Gold Investors ‘Give Up Hope’ as Biggest Short in History Builds


https://www.bloomberg.com/news/articles/2018-08-20/gold-investors-give-up-hope-as-biggest-short-in-history-builds

Gold is hitting new milestones of misery.

Exchange-traded funds tracking the metal have bled assets for 13 consecutive weeks, the longest run in five years, investors have placed the biggest gold short on record, and bullion’s chief foe -- a strong dollar -- is extending its market grip.

Selling Gold

ETF investors were net sellers for thirteen consecutive weeks
Source: Bloomberg
Gold’s 9 percent tumble this year belies the turmoil in emerging markets and jitters over technology companies, the anchor of the U.S. equity bull market.
“The long suffering holders of ETFs have finally given up hope of the yellow metal returning to its former glories and have decided there is better protection in the dollar, the stock market and pretty much anything other than gold,” David Govett, head of precious metals at Marex Spectron, said by email. “I can only say that gold, as a safe haven, has been a massive disappointment this year.”
Hedge funds and other large speculators increased net-short bets on the precious metal in the week ending Aug. 14 to the most on record, according to data published Friday going back to 2006.
While investors in the world’s largest ETF market have pulled $1.4 billion from gold-backed funds this year, it’s a different story for non-dollar-based buyers in the rest of the world.
In Europe, gold ETFs have added $1.3 billion since January, led by the X-Trackers Physical Gold product, which has more than tripled in size. Money managers across Asia have been almost as keen, adding $1.1 billion to the products this year.
“We’ve seen strong inflows over the last two weeks,” Nitesh Shah, a London-based commodity strategist at WisdomTree, which runs a Europe-listed ETF, said on Friday. “A lot of investors are seeing a bargain-hunting opportunity.”

Dollar Pain

Greenback's strength has made gold less appealing to U.S. investors
Source: Bloomberg
Note: Excludes leveraged funds
Pain in the gold market could intensify. When prices last plumbed current lows, ETF vaults contained about 61 million ounces of bullion. Now, there’s about $8.6 billion of loss-making metal weighing down portfolios in funds tracked by Bloomberg.
“That’s one of the main concerns for gold price action in the near term,” said Suki Cooper, a precious metals analyst at Standard Chartered, on Bloomberg TV on Friday. “Over the past couple of years, we’ve seen the key driver for gold changing from tracking real yields most closely to the start of this year being the dollar.”
— With assistance by Ramy Inocencio, and Yvonne Man

Gold Won’t Protect You From Hyperinflation

https://www.barrons.com/articles/gold-wont-protect-you-from-hyperinflation-1534952739 


Gold Won’t Protect You From Hyperinflation

Venezuela‘s currency, the bolivar, has become nearly worthless.Venezuela‘s currency, the bolivar, has become nearly worthless. Photo: Federico Parra/AFP/Getty Images
 
Venezuela is a perfect current test case for those who believe gold is a good hedge against hyperinflation.
That’s because Venezuela is currently suffering from one of history’s most extreme cases of hyperinflation. The country’s currency, the bolivar, has become nearly worthless; news reports indicate that the government has had difficulty even paying for the paper needed to print up the currency. The International Monetary Fund projects Venezuelan inflation to reach one million percent this year.
The situation is reminiscent of what historically has been history’s paradigmatic examples of hyperinflation, such as Germany after World War I. In 1922 and 1923, the exchange rate between the German mark and the U.S. dollar (which was pegged to gold) rose from 430-to-1 to 433 billion-to-1.
On the surface, it certainly seems as though the yellow metal has passed the test. So far this year, for example, an ounce of gold has skyrocketed to nearly 200 million Venezuelan bolivars from around 13,000 at the beginning of the year.
Believe it or not, however, this huge increase has probably not been enough to keep up with Venezuelan inflation. I say “probably” because reliable economic data is notoriously hard to come by when a currency’s value is evaporating so rapidly. For example, some currently are arguing that the IMF estimated inflation rate of one million percent is too low.
Claude Erb isn’t surprised that bolivar-denominated gold has failed to keep up with inflation. He is a former commodities and fixed income manager at TCW Group and the author, with Campbell Harvey, a Duke University finance professor, of a study that was circulated a few years ago by the National Bureau of Economic Research. They found that gold typically doesn’t maintain its purchasing power during a hyperinflation. In other words, its real price usually declines during such periods.
One case study of hyperinflation that Erb and Harvey examined in detail occurred in Venezuela’s neighbor Brazil between 1980 and 2000, during which cumulative inflation totaled nearly 13 trillion percent—equivalent to about 250% on an annualized basis. They report that, over those two decades, the real price of gold in Brazilian currency terms fell by about 70%.
Careful students of history will notice that this 70% decline is quite close to the inflation-adjusted decline suffered by a U.S. dollar-denominated investor in gold over this same period. That is not an accident, Erb explains to Barron’s in an email. That’s because, once you adjust different countries’ exchange rates for their varying inflation rates, gold’s price should be the same regardless of the currency in which it’s denominated.
As a result, gold’s inflation-adjusted return should be roughly the same regardless of the currency in which gold is bought or sold. “Even though countries, such as U.S. or Brazil, may experience very different inflation experiences their real gold return experiences will probably be similar,” Erb and Harvey wrote. “There is no reason to expect that the real return will be positive when a specific country experiences hyperinflation.”
Gold bugs object to this conclusion, often pointing to a book that has acquired near-Biblical status among gold’s true believers: The Golden Constant: The English and American Experience 1560-2007, by the late Roy Jastram, then a professor of business at the University of California, Berkeley, and originally published in the 1970s. Jastram found from his analysis of the historical record that gold is a decent inflation hedge over the long term.
But it’s crucial to understand that the long term for Jastram is much longer than any of our investment horizons. Erb’s and Harvey’s study reached a similar conclusion, since they also found that over very long periods—measured in many, many decades—gold does keep pace with inflation. Erb points out that for both Jastram as well as for his and Harvey’s study, “the short run was the next few years, and the long run was perhaps a century.”
To be sure, it’s always possible that—over the shorter term—gold will produce a positive real return during a period in which a country somewhere in the world experiences hyperinflation. But the crucial takeaway from Erb’s and Harvey’s study is that you can’t count on it.
If you’re looking for an investment that is guaranteed to keep pace with inflation, a better alternative to gold might be Treasury inflation-protected securities, or TIPS. These are Treasury notes or bonds whose principal is guaranteed to grow with the U.S. consumer-price index. The exchange-traded fund that invests in TIPS with the most assets under management is iShares TIPS Bond(ticker: TIP), which charges annual expenses of 0.20%.
Email: editors@barrons.com

Thursday, June 7, 2018

Tech Stocks Are Hitting Highs as Economic Uncertainty Rises

https://www.nytimes.com/2018/06/05/business/dealbook/tech-stocks-economic-uncertainty.html?smid=tw-nytimesbusiness&smtyp=cur

Tech Stocks Are Hitting Highs as Economic Uncertainty Rises


By Stephen Grocer

  • Investors have returned to the safety and growth of the biggest technology stocks.

    Five big tech companies — Apple, Amazon, Microsoft, Netflix and Nvidia — closed at historic highs on Tuesday. Alibaba and Facebook have done the same in recent days. The tech-heavy Nasdaq Composite has returned to record territory, up 8 percent since the end of April. The Standard & Poor’s 500-stock index and the Dow Jones industrial average remain 4.3 percent and 6.8 percent off the records they set on Jan. 26.
    The rally has come as the global economy shows signs of strain. Fears of a trade war have made investors anxious; emerging market stocks, bonds and currencies have all sold off; and economic data in some regions has softened in recent weeks.
    “In an uncertain world with significant downside economic tail risks, technology has been seen to be, correctly, relatively stable,” Peter Oppenheimer and Guillaume Jaisson, strategists at Goldman Sachs, wrote in a recent report.

    Such economic uneasiness in the years since the financial crisis had caused investors to pour money into the sector. The likes of Facebook, Alphabet, Amazon and Apple have come to be viewed as having nearly unassailable revenue streams that could deliver growth in most economic conditions. With interest rates at historic lows and economic growth lackluster, investors have found that appealing.
    Advertisement
    “Investors have been well served by the current global dominance of American tech companies, and yet there is plenty of chatter about changing this winning approach,” Nicholas Colas, co-founder of DataTrek Research, said in a recent note.

    In March, some of the best performing tech stocks began to struggle. Facebook’s handling of user data in the Cambridge Analytica scandal contributed to a backlash against the size and reach of the biggest tech companies, and raised concerns that regulators may soon crack down on these firms.

    The pullback was a rare dip for a sector that had risen consistently for the past several years. Since stock markets in the United States bottomed out in March 2009, shares of Apple, Amazon, Nvidia, Microsoft and Alphabet have all gained more than 500 percent; Netflix is up 6,500 percent. The S.&P. 500 has risen about 300 percent over that period.

    How long can the biggest tech stocks dominate the market? For a while, Mr. Oppenheimer and Mr. Jaisson said. They pointed out that earnings and sales growth, not a speculative increase in valuations, have driven the post-financial crisis run-up.

    “Unlike the technology mania of the 1990s, most of this success can be explained by strong fundamentals, revenues and earnings rather than speculation about the future,” Mr. Oppenheimer and Mr. Jaisson wrote.

    Friday, June 1, 2018

    Price Is What You Pay; Value Is What You Get - Nifty Fifty Edition


    Price Is What You Pay; Value Is What You Get - Nifty Fifty Editionhttp://www.fortunefinancialadvisors.com/blog/price-is-what-you-pay-value-is-what-you-get-nifty-fifty-edition

    by: Lawrence Hamtil     
    RSS Subscribe via RSS Every investor is aware of Warren Buffet's famous dictum that, "Price is what you pay; value is what you get."  That of course applies to the valuation an investor is willing to pay for a given company's stock, and the subsequent returns he receives for doing so.  In today's environment, in which commentary focuses on the lofty multiples that characterize much of the U.S. stock market, particularly on some very popular names like Facebook, Amazon, and Netflix, I thought it would be interesting to revisit the "Nifty Fifty" era of the early 1970s, when the Amazons and Facebooks of the day were what became today's boring blue chips:  McDonald's, Merck, Procter & Gamble, and so forth.
    At the peak of the Nifty Fifty 'bubble,' many of these stocks traded at extreme premiums to the market, with shares of McDonald's changing hands at a multiple of eighty-five times earnings, and Coca Cola trading at close to fifty times (data via Brooklyn Investor)*:

    Given these extreme valuations, I wanted to see how investors in those companies fared had they been willing to pay up to own these names.  To test this, I decided to pick seven names I considered to be more expensive than others, and seven names I considered to be cheaper.  Given that many of the Nifty Fifty names no longer exist due to merger and, in some cases, bankruptcy, I chose for each group names that, as much as possible, exist today more or less as they did then.  Additionally, I wanted to control for sector and industry differences as much I could, so both pools ended up heavy in terms of consumer staple and healthcare stocks.  Finally, I ran the numbers starting on June 1st, 1972 (the earliest date available to me), and calculated the annualized total return for each stock over the subsequent ten-, twenty-, thirty-, and forty-year periods.  Here are the results:

    What immediately stands out to me is that, over the initial ten-year period from peak valuation, the cheaper group generally outperformed the more expensive group.  It is important to remember that during this period from June of 1972 to June of 1982 there was a huge market crash and lengthy bear market spanning much of 1973-1974.  Just about all of these names were crushed during this downturn, so valuation did not really matter during the crash.  However, it would appear that the companies with less demanding valuations emerged from the crash in better shape than those with more extreme valuations.
    Of the two groups, the two names that jump out to me are Pepsico and Coca Cola.  They both are dominant players in the soft drink industry, with global reach.  Their business models are not all that different from each other.  Yet, at its peak, Coca Cola traded at a 60% premium to Pepsico.  At the risk of oversimplifying things, I would suggest that this huge premium played a large part in Coca Cola underperforming Pepsico by almost 1,000 basis points over the subsequent ten years.   
    On the other hand, over the much longer periods twenty and thirty years, both Coca Cola and Pepsico generated similarly strong results, which suggests that starting valuation matters much less over much longer time frames.  This was generally the case for almost all the stocks observed.
    The lesson from this exercise, I believe, is that investors should always be conscious of starting valuation when placing their bets.  With few exceptions, eventually valuations that are simply too high will drift back down to more reasonable levels, often at the expense of poor intermediate-term performance.  This appears to be true no matter how revolutionary the new business appears to be, and no matter how much potential you believe it has.  Of course, if your conviction is such that you plan on holding your shares for multiple decades, valuation may indeed matter less to long-term returns, but that is assuming you follow through on your commitment.  Over several years of sub par performance, that is much easier said than done.


    *Note, Brooklyn Investor does not specify in his post, but the P/E multiple shown is assumed to be based on trailing twelve-months' earnings.

    Why Corporate Profits May Be Weaker Than They Seem

    Why Corporate Profits May Be Weaker Than They Seem

    Government data shows profits were weak in the first quarter and would have been down without the tax cut


    According to companies, profits were great in the first quarter. According to governmenthttps://www.wsj.com/articles/why-corporate-profits-may-be-weaker-than-they-seem-1527701696

    Housing Sector Analysis: Headwinds Grow As Rates Tick Higher

    There are a large number of public and private services that measure the change in home prices.
    The algorithms behind these services, while complex, are primarily based on recent sale prices for comparative homes and adjusted for factors like location, property characteristics and the particulars of the house.
     
    While these pricing services are considered to be well represented measures of house prices, there is another important factor that is frequently overlooked despite the large role in plays in house prices.
    In August 2016, the 30-year fixed mortgage rate as reported by the Federal Reserve hit an all-time low of 3.44%.
    Since then it has risen to its current level of 4.50%.
    While a 1% increase may appear small, especially at this low level of rates, the rise has begun to adversely affect housing and mortgage activity. After rising 33% and 22% in 2015 and 2016 respectively, total mortgage originations were down -16% in 2017. Further increases in rates will likely begin to weigh on house prices and the broader economy. This article will help quantify the benefit that lower rates played in making houses more affordable over the past few decades. By doing this, we can appreciate how further increases in mortgage rates might adversely affect house prices.
    Lower Rates
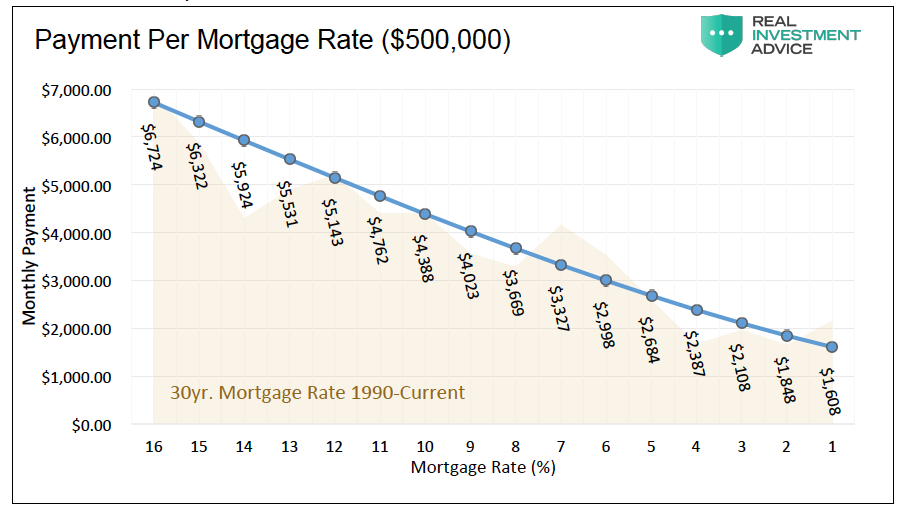
    In 1981 mortgage rates peaked at 18.50%. Since that time they have declined steadily and now stands at a relatively paltry 4.50%. Over this 37-year period, individuals’ payments on mortgage loans also declined allowing buyers to get more for their money. Continually declining rates also allowed them to further reduce their payments through refinancing. Consider that in 1990 a $500,000 house, bought with a 10%, 30-year fixed rate mortgage, which was the going rate, would have required a monthly principal and interest payment of $4,388. Today a loan for the same amount at the 4.50% current rate is almost half the payment at $2,533.
    The sensitivity of mortgage payments to changes in mortgage rates is about 9%, meaning that each 1% increase or decrease in the mortgage rate results in a payment increase or decrease of 9%. From a home buyer’s perspective, this means that each 1% change in rates makes the house more or less affordable by about 9%.
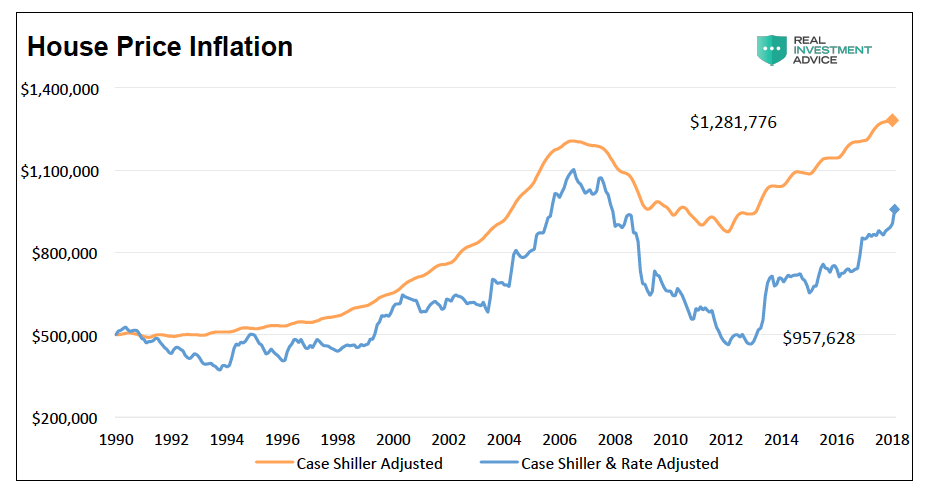
    Given this understanding of the math and the prior history of rate declines, we can calculate how lower rates helped make housing more affordable. To do this, we start in the year 1990 with a $500,000 home price and adjust it annually based on changes in the popular Case-Shiller House Price Index. This calculation approximates the 28-year price appreciation of the house. Second, we further adjust it to the change in interest rates. To accomplish this, we calculated how much more or less home one could buy based on the change in interest rates. The difference between the two, as shown below, provides a value on how much lower interest rates benefited home buyers and sellers.

    The graph shows that lower payments resulting from the decline in mortgage rates benefited buyers by approximately $325,000. Said differently, a homeowner can afford $325,000 more than would have otherwise been possible due to declining rates.
    The Effect of Rising Rates
    As stated, mortgage rates have been steadily declining for the past 37 years. There are some interest rate forecasters that believe the recent uptick in rates may be the first wave of a longer-term change in trend.  If this is, in fact, the case, quantifying how higher mortgage rates affect payments, supply, demand, and therefore the prices of houses is an important consideration for the direction of the broad economy.
    The graph below shows the mortgage payment required for a $500,000 house based on a range of mortgage rates. The background shows the decline in mortgage rates (10.00% to 4.50%) from 1990 to today.
    monthly payment per interest rate point increase 500 thousand mortgage
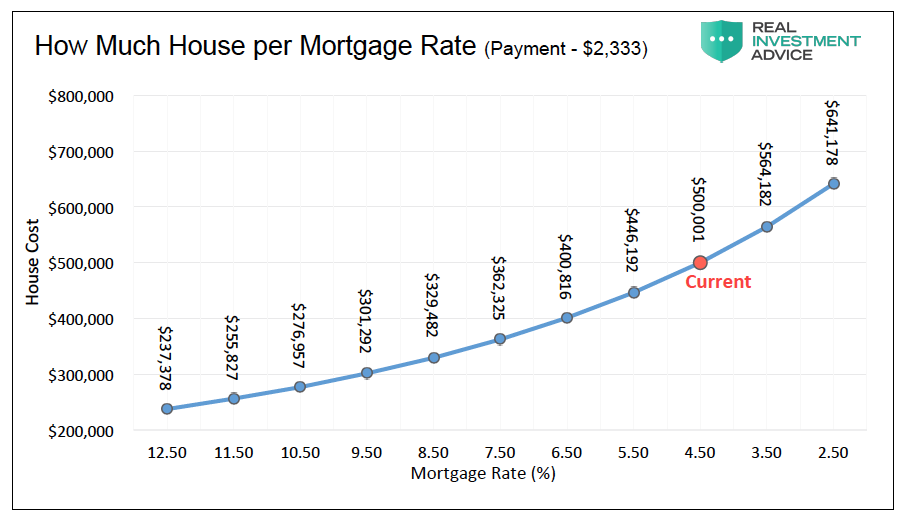
    To put this into a different perspective, the following graph shows how much a buyer can afford to pay for a house assuming a fixed payment ($2,333) and varying mortgage rates. The payment is based on the current mortgage rate.
    how much house afford price rates rising chart intersection_year 2018
    As the graphs portray, home buyers will be forced to make higher mortgage payments or seek lower-priced houses if rates keep rising.
    Summary
    The Fed has raised interest rates six times since the end of 2015. Their forward guidance from recent Federal Open Market Committee (FOMC) meeting statements and minutes tells of their plans on continuing to do so throughout this year and next. Additionally, the Fed owns over one-quarter of all residential mortgage-backed securities (MBS) through QE purchases. Their stated plan is to reducetheir ownership of those securities over the next several quarters. If the Fed continues on their expected path with regard to rates and balance sheet, it creates a significant market adjustment in terms of supply and demand dynamics and further implies that mortgage rates should rise.
    The consequences of higher mortgage rates will not only affect buyers and sellers of housing but also make borrowing on the equity in homes more expensive. From a macro perspective, consider that housing contributes 15-18% to GDP, according to the National Association of Home Builders (NAHB). While we do not expect higher rates to devastate the housing market, we do think a period of price declines and economic weakness could accompany higher rates.
    This analysis is clinical using simple math to illustrate the relationship, cause, and effects, between changes in interest rates and home prices. However, the housing market is anything but a simple asset class. It is among the most complex of systems within the broad economy. Rising rates not only impact affordability but also the general level of activity which feeds back into the economy. In addition to the effect that rates may have, also consider that the demographics for housing are challenged as retiring, empty-nest baby boomers seek to downsize. To whom will they sell and at what price?
    If interest rates do indeed continue to rise, there is a lot more risk embedded in the housing market than currently seems apparent as these and other dynamics converge. The services providing pricing insight into the value of the housing market may do a fine job of assessing current value, but they lack the sophistication required to see around the next economic corner.

    Twitter:  @michaellebowitz