Tuesday, May 27, 2014

Tuesday, May 6, 2014
Morgan Stanley on Gold: Still Dour After a Nasty Year
http://blogs.barrons.com/focusonfunds/2014/04/28/morgan-stanley-on-gold-still-dour-after-a-nasty-year/?mod=BOLBlog
On the contrary, the firm’s Joel Crane and six co-authors argue instance that weaker Chinese demand could the thing that causes prices to erode even more.
Here’s how that could happen: The weakening yuan. The Chinese currency’s downswing reduces the purchasing power of Chinese consumers, cutting down the amount of gold each yuan can buy.
What’s more, the firm sees the handful of factors helping to support
gold’s price lately and its 7% year-to-date rise — trouble in Crimea, worries about the U.S. economy, and worries about Chinese growth — taking a back seat.
At least the ETF sellers of 2013 have stepped back, not that this convinces the group that gold is set to rise again:
By Brendan Conway
The commodity strategists at Morgan Stanley write today that record demand from China won’t be enough to keep gold’s price above $1,200 per ounce in the coming year, much less help it rise.On the contrary, the firm’s Joel Crane and six co-authors argue instance that weaker Chinese demand could the thing that causes prices to erode even more.
Here’s how that could happen: The weakening yuan. The Chinese currency’s downswing reduces the purchasing power of Chinese consumers, cutting down the amount of gold each yuan can buy.

At least the ETF sellers of 2013 have stepped back, not that this convinces the group that gold is set to rise again:
After the heavy sell-off in 2013, ETFs have largely refrained from further selling in 2014 on expectations of EM fund outflows sustaining into safe-haven assets. However, we see near-term headwinds remaining substantial for interest in gold to recover. CFTC net long positions in gold, currently at October 2013 levels, also indicate tepid interest from investors.All those factors lead the MS strategists to predict an average gold price of $1,250 per ounce this quarter, followed by declines to an average $1,168 in the second half and $1,138 next year.

Thursday, May 1, 2014
Dow at record highs but these 3 sectors still have value
Industrials
“Industrials are a play on
business capital spending.” They’re no longer a play on China, he says,
as investors need to focus on growing infrastructure spending in the
U.S. and Europe. Despite yesterday’s poor GDP report, Canally says by
the end of the year we can expect to see 3% GDP growth in the U.S., and
that means industrials are one of his top plays for capitalizing on an
“accelerating” economy.
Small Caps
Canally’s last pick is an interesting one. Small caps (^RUT)
have been getting picked apart lately, after nearing all-time highs
earlier in April. They tend to do the best during periods of high
growth, and during those times investors are more willing to take on
risk for the possibility of higher returns.
The domestic focus is what
Cannaly is looking at. “Small Caps generally focus on the U.S… we’re
getting better job growth,” he says. “Small Caps are generally a good
play on the credit cycle, they’re in the sweet spot there,” as Canally
notes rates should stay low for quite some time.
Wednesday, April 30, 2014
The Average Stock Is More Expensive Now Than It Was At The Peak Of The Dot-Com Bubble In 2000 Read more: http://www.businessinsider.com/stock-market-and-investing-outlook-2014-4#ixzz30OA6DZJH
http://www.businessinsider.com/stock-market-and-investing-outlook-2014-4
The unsettling market plunges of two weeks ago have stopped (at least for now), and stock prices have recovered a bit. So now everyone's getting cautiously bullish again.
Everyone except me.
I still think stocks are poised to have a decade or more of lousy returns.
Why?
Three simple reasons:
But first, a quick description of what I mean by "a decade or more of lousy returns" — and a note on how I am positioning my own portfolio in light of this view.
To be clear: I don't know what stocks are going to do next. They could go higher from today's already high prices, the way they did from similar levels in the late 1990s. They could crash, the way they did in 2000, 2007, and many other periods in which prices were (almost) this high. They could stay flat for years, the way they did in the late 1960s and '70s. All I know is, unless "it's different this time" — the four most expensive words in the English language — stocks are priced to return only about 2.5% per year for the next decade, a far cry from the 10% per year long-term average.
I own lots of stocks, though, and I'm not selling them. Why not? Many reasons, including:
First, price.
Even after the recent drops from the peak, stocks appear to be very expensive. By one measure, they're even more expensive than they were at the peak of the "Great Bubble" in 2000 — the highest stock prices in history!
The chart below is from Yale professor Robert Shiller. It shows the cyclically adjusted price-earnings ratio of the S&P 500 for the last 130 years. As you can see, today's P/E ratio of 25X is miles above the long-term average of 15X. In fact, it's higher than at any point in the 20th century with the exception of the peaks of 1929 and 2000 (you know what happened after those).
Does a high PE mean the market is going to crash? No. But unless it's "different this time," a high PE means we're likely to have lousy returns for the next seven to 10 years.
By the way, in case some of your bullish friends have convinced you that Professor Shiller's P/E analysis is flawed, check out the chart below. It's from fund manager John Hussman. It shows six valuation measures in addition to the Shiller P/E that have been highly predictive of future returns over the past century. The left scale shows the predicted 10-year return for stocks according to each valuation measure. The colored lines (except green) show the predicted return for each measure at any given time. The green line is the actual return over the 10 years from that point (it ends 10 years ago). Today, the average expected return for the next 10 years is slightly positive — about 2% a year. That's not horrible. But it's a far cry from the 10% long-term average.
John Hussman also observes something else that is interesting: The median stock is more expensive now than it was in 2000!
That's right.
The stock market in the late 1990s was so skewed by the prices of tech stocks and other growth stocks that the median stock wasn't that expensive. Now, small-cap and growth stocks have performed so well for so long that the median stock is more expensive than it was then. Yikes!
(Happily, some big slow-growth stocks are reasonably priced right now — less than 15X earnings. If you're desperate to buy stocks, those are probably a good place to start).
So that's price. Next comes profit margins.
One reason stocks are so expensive these days is that investors are comparing stock prices to this year's earnings and next year's expected earnings. In some years, when profit margins are normal, this valuation measure is meaningful. In other years, however — at the peak or trough of the business cycle — comparing prices to one year's earnings can produce a very misleading sense of value.
Have a glance at this recent chart of profits as a percent of the economy. Today's profit margins are the highest in history, by a mile. Note that, in every previous instance in which profit margins have reached extreme levels — high and low — they have subsequently reverted to (or beyond) the mean. And when profit margins have reverted, so have stock prices.
Now, you can tell yourself stories about why, this time, profit margins have reached a "permanently high plateau," as the famous economist Irving Fisher remarked about stock prices in 1929, just before the crash. And, unlike Irving Fisher, you might be right. But as you are telling yourself these stories, please recognize that what you are really saying is "It's different this time."
And then there's Fed tightening.
For the last five years, the Fed has been frantically pumping money into Wall Street, keeping interest rates low to encourage hedge funds and other investors to borrow and speculate. This free money, and the resulting speculation, has helped drive stocks to their current very expensive levels.
But now the Fed is starting to "take away the punch bowl," as Wall Street is fond of saying.
Specifically, the Fed is beginning to reduce the amount of money that it is pumping into Wall Street.
To be sure, for now, the Fed is still pumping oceans of money into Wall Street. But, in the past, it has been the change in direction of Fed money-pumping that has been important to the stock market, not the absolute level.
In the past, major changes in direction of Fed money-pumping have often been followed by changes in direction of stock prices. Not always. But often.
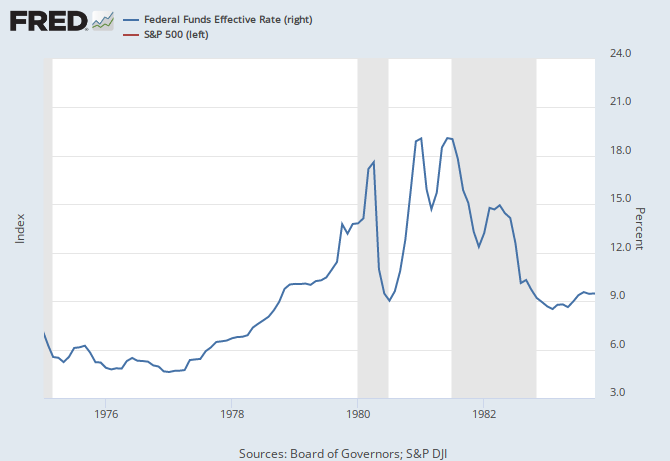
Here's a look at the last 50 years. The blue line is the Fed Funds rate (a proxy for the level of Fed money-pumping.) The red line is the S&P 500. Note that Fed policy goes through "tightening" and "easing" phases, just as stocks go through bull and bear markets. And sometimes these phases are correlated.
Now, let's zoom in. In many of these time periods, you'll see that sustained Fed tightening has often been followed by a decline in stock prices. Again, not always, but often. You'll also see that most major declines in stock prices over this period have been preceded by Fed tightening.
Here's the first period, 1964 to 1980. There were three big tightening phases during this period (blue line) ... and three big stock drops (red line). Good correlation!
Now 1975 to 1982, which overlaps a bit with the chart above. The Fed started tightening in 1976, at which point the market declined and then flattened for four years. Steeper tightening cycles in 1979 and 1980 were also followed by price drops.
From 1978 to 1990, we see the two drawdowns described above, as well as another tightening cycle followed by flattening stock prices in the late 1980s. Again, tightening precedes crashes.

And, lastly, 1990 to 2014. For those who want to believe that Fed tightening is irrelevant, there's good news here: A sharp tightening cycle in the mid-1990s did not lead to a crash! Alas, two other tightening cycles, one in 1999 to 2000 and the other from 2004 to 2007 were followed by major stock market crashes.
One of the oldest sayings on Wall Street is "Don't fight the Fed." This saying has meaning in both directions, when the Fed is easing and when it is tightening. A glance at these charts shows why.
On the positive side, the Fed's tightening phases have often lasted a year or two before stock prices peaked and began to drop. So even if you're convinced that sustained Fed tightening now will likely lead to a sharp stock-price pullback at some point, the bull market might still have a ways to run.
So those are three reasons why I think stocks are poised to have lousy returns over the next decade and that the stock market might well crash — price, profit margins, and Fed tightening.
None of this means for sure that the market will crash or that you should sell stocks (again, I own stocks, and I'm not selling them.) It does mean, however, that you should be mentally prepared for the possibility of a major pullback and lousy long-term returns.
The unsettling market plunges of two weeks ago have stopped (at least for now), and stock prices have recovered a bit. So now everyone's getting cautiously bullish again.
Everyone except me.
I still think stocks are poised to have a decade or more of lousy returns.
Why?
Three simple reasons:
- Stocks are very expensive
- Corporate profit margins are at record highs
- The Fed is now tightening
But first, a quick description of what I mean by "a decade or more of lousy returns" — and a note on how I am positioning my own portfolio in light of this view.
To be clear: I don't know what stocks are going to do next. They could go higher from today's already high prices, the way they did from similar levels in the late 1990s. They could crash, the way they did in 2000, 2007, and many other periods in which prices were (almost) this high. They could stay flat for years, the way they did in the late 1960s and '70s. All I know is, unless "it's different this time" — the four most expensive words in the English language — stocks are priced to return only about 2.5% per year for the next decade, a far cry from the 10% per year long-term average.
I own lots of stocks, though, and I'm not selling them. Why not? Many reasons, including:
- I have a diversified portfolio (stocks, bonds, cash, real estate), which will cushion the blow of a crash
- I am psychologically comfortable with the possibility of a 40%-to-50% market crash, and I know exactly what I will do if we get one (buy stocks). If you aren't comfortable with the possibility of a crash of this magnitude, you should either get comfortable with it or reduce your stockholdings. Otherwise, you might panic and sell after a crash, which is the worst thing you can do.
- No other asset classes are attractively priced, either. Unfortunately, it looks as though we're set up to have one of the worst decades in history in terms of the performance of financial assets.
First, price.
Even after the recent drops from the peak, stocks appear to be very expensive. By one measure, they're even more expensive than they were at the peak of the "Great Bubble" in 2000 — the highest stock prices in history!
The chart below is from Yale professor Robert Shiller. It shows the cyclically adjusted price-earnings ratio of the S&P 500 for the last 130 years. As you can see, today's P/E ratio of 25X is miles above the long-term average of 15X. In fact, it's higher than at any point in the 20th century with the exception of the peaks of 1929 and 2000 (you know what happened after those).

Does a high PE mean the market is going to crash? No. But unless it's "different this time," a high PE means we're likely to have lousy returns for the next seven to 10 years.
By the way, in case some of your bullish friends have convinced you that Professor Shiller's P/E analysis is flawed, check out the chart below. It's from fund manager John Hussman. It shows six valuation measures in addition to the Shiller P/E that have been highly predictive of future returns over the past century. The left scale shows the predicted 10-year return for stocks according to each valuation measure. The colored lines (except green) show the predicted return for each measure at any given time. The green line is the actual return over the 10 years from that point (it ends 10 years ago). Today, the average expected return for the next 10 years is slightly positive — about 2% a year. That's not horrible. But it's a far cry from the 10% long-term average.

John Hussman also observes something else that is interesting: The median stock is more expensive now than it was in 2000!
That's right.
The stock market in the late 1990s was so skewed by the prices of tech stocks and other growth stocks that the median stock wasn't that expensive. Now, small-cap and growth stocks have performed so well for so long that the median stock is more expensive than it was then. Yikes!
(Happily, some big slow-growth stocks are reasonably priced right now — less than 15X earnings. If you're desperate to buy stocks, those are probably a good place to start).
So that's price. Next comes profit margins.
One reason stocks are so expensive these days is that investors are comparing stock prices to this year's earnings and next year's expected earnings. In some years, when profit margins are normal, this valuation measure is meaningful. In other years, however — at the peak or trough of the business cycle — comparing prices to one year's earnings can produce a very misleading sense of value.
Have a glance at this recent chart of profits as a percent of the economy. Today's profit margins are the highest in history, by a mile. Note that, in every previous instance in which profit margins have reached extreme levels — high and low — they have subsequently reverted to (or beyond) the mean. And when profit margins have reverted, so have stock prices.

Now, you can tell yourself stories about why, this time, profit margins have reached a "permanently high plateau," as the famous economist Irving Fisher remarked about stock prices in 1929, just before the crash. And, unlike Irving Fisher, you might be right. But as you are telling yourself these stories, please recognize that what you are really saying is "It's different this time."
And then there's Fed tightening.
For the last five years, the Fed has been frantically pumping money into Wall Street, keeping interest rates low to encourage hedge funds and other investors to borrow and speculate. This free money, and the resulting speculation, has helped drive stocks to their current very expensive levels.
But now the Fed is starting to "take away the punch bowl," as Wall Street is fond of saying.
Specifically, the Fed is beginning to reduce the amount of money that it is pumping into Wall Street.
To be sure, for now, the Fed is still pumping oceans of money into Wall Street. But, in the past, it has been the change in direction of Fed money-pumping that has been important to the stock market, not the absolute level.
In the past, major changes in direction of Fed money-pumping have often been followed by changes in direction of stock prices. Not always. But often.
Here's a look at the last 50 years. The blue line is the Fed Funds rate (a proxy for the level of Fed money-pumping.) The red line is the S&P 500. Note that Fed policy goes through "tightening" and "easing" phases, just as stocks go through bull and bear markets. And sometimes these phases are correlated.

Now, let's zoom in. In many of these time periods, you'll see that sustained Fed tightening has often been followed by a decline in stock prices. Again, not always, but often. You'll also see that most major declines in stock prices over this period have been preceded by Fed tightening.
Here's the first period, 1964 to 1980. There were three big tightening phases during this period (blue line) ... and three big stock drops (red line). Good correlation!

Now 1975 to 1982, which overlaps a bit with the chart above. The Fed started tightening in 1976, at which point the market declined and then flattened for four years. Steeper tightening cycles in 1979 and 1980 were also followed by price drops.

From 1978 to 1990, we see the two drawdowns described above, as well as another tightening cycle followed by flattening stock prices in the late 1980s. Again, tightening precedes crashes.
Business Insider, St. Louis Fed
And, lastly, 1990 to 2014. For those who want to believe that Fed tightening is irrelevant, there's good news here: A sharp tightening cycle in the mid-1990s did not lead to a crash! Alas, two other tightening cycles, one in 1999 to 2000 and the other from 2004 to 2007 were followed by major stock market crashes.

One of the oldest sayings on Wall Street is "Don't fight the Fed." This saying has meaning in both directions, when the Fed is easing and when it is tightening. A glance at these charts shows why.
On the positive side, the Fed's tightening phases have often lasted a year or two before stock prices peaked and began to drop. So even if you're convinced that sustained Fed tightening now will likely lead to a sharp stock-price pullback at some point, the bull market might still have a ways to run.
So those are three reasons why I think stocks are poised to have lousy returns over the next decade and that the stock market might well crash — price, profit margins, and Fed tightening.
None of this means for sure that the market will crash or that you should sell stocks (again, I own stocks, and I'm not selling them.) It does mean, however, that you should be mentally prepared for the possibility of a major pullback and lousy long-term returns.
Why Value Investing is So Hard (Russian Edition)
http://mebfaber.com/2014/03/26/why-value-investing-is-so-hard-russian-edition/
Many
times on this blog I’ve mentioned that for every investing strategy
there needs to be a fundamental reason why it works. A basic, “explain
to your 12 year old niece reason why it works”. Value investing, at its
most basic, is buying $1 for $.80 (or less than intrinsic value). Most
of the alpha out there (or smart beta or whatever it is being called
these days) is either hard to find or hard to DO. And by do, I mean it
goes against everything your behavioral instincts tell you to do.
Buying a stock at all time highs is hard to do, and one reason momentum
and trend work. Buying a value investment is hard for many reasons, a
few of which I outline below with a very relevant current example,
Russian stocks.
1. All of the headlines are negative.
2. The investment has declined, usually by A LOT.
3. All of the trailing fundamentals are really bad.
4. People can find many reasons why “this time is different” for the value metrics not to be reflective of the current situation.
5. There is a non-zero risk of the investment going to zero.
6. It is not popular (or patriotic) to own the investment.
7. Buying the investment, and it going down more, would pose serious career risk. (or divorce risk).
8. The banking consensus is all sell rated.
9. Flows are out.
Russia checks all of these boxes and then some.
For the same reason we recommend to never put all your eggs in one basket with a single stock, the same goes for countries too. If you plan on value investing with countries it makes sense to buy a basket rather than just one or two. As was the case with Greece going to a CAPE of 2 in 2012, Russia could easily get cut in half again. But secular bears set the stage for secular bulls, and vice versa. Off to pizza in Phoenix.
- See more at: http://mebfaber.com/2014/03/26/why-value-investing-is-so-hard-russian-edition/#sthash.kzcijsje.dpuf
1. All of the headlines are negative.
2. The investment has declined, usually by A LOT.
3. All of the trailing fundamentals are really bad.
4. People can find many reasons why “this time is different” for the value metrics not to be reflective of the current situation.
5. There is a non-zero risk of the investment going to zero.
6. It is not popular (or patriotic) to own the investment.
7. Buying the investment, and it going down more, would pose serious career risk. (or divorce risk).
8. The banking consensus is all sell rated.
9. Flows are out.
Russia checks all of these boxes and then some.
For the same reason we recommend to never put all your eggs in one basket with a single stock, the same goes for countries too. If you plan on value investing with countries it makes sense to buy a basket rather than just one or two. As was the case with Greece going to a CAPE of 2 in 2012, Russia could easily get cut in half again. But secular bears set the stage for secular bulls, and vice versa. Off to pizza in Phoenix.
- See more at: http://mebfaber.com/2014/03/26/why-value-investing-is-so-hard-russian-edition/#sthash.kzcijsje.dpuf
Many times on this blog I’ve mentioned that for every
investing strategy there needs to be a fundamental reason why it works. A basic, “explain to your 12 year old niece
reason why it works”. Value investing,
at its most basic, is buying $1 for $.80 (or less than intrinsic value). Most of the alpha out there (or smart beta or
whatever it is being called these days) is either hard to find or hard to
DO. And by do, I mean it goes against
everything your behavioral instincts tell you to do. Buying a stock at all time highs is hard to
do, and one reason momentum and trend work.
Buying a value investment is hard for many reasons, a few of which I
outline below with a very relevant current example, Russian stocks.
1.
All of the headlines are negative.
2.
The investment has declined, usually by A LOT.
3.
All of the trailing fundamentals are really bad.
4.
People can find many reasons why “this time is
different” for the value metrics not to be reflective of the current situation.
5.
There is a non-zero risk of the investment going
to zero.
6.
It is not popular (or patriotic) to own the
investment.
7.
Buying the investment, and it going down
more, would pose serious career risk.
(or divorce risk).
8.
The banking consensus is all sell rated.
9.
Flows are out.
Russia checks all of these boxes and then some.
For the same reason we recommend to never put all your eggs
in one basket with a single stock, the same goes for countries too. If you plan on value investing with countries
it makes sense to buy a basket rather than just one or two. As was the case with Greece going to a CAPE
of 2 in 2012, Russia could easily get cut in half again. But secular bears set the stage for secular
bulls, and vice versa. Off to pizza in
Phoenix.
- See more at:
Many
times on this blog I’ve mentioned that for every investing strategy
there needs to be a fundamental reason why it works. A basic, “explain
to your 12 year old niece reason why it works”. Value investing, at its
most basic, is buying $1 for $.80 (or less than intrinsic value). Most
of the alpha out there (or smart beta or whatever it is being called
these days) is either hard to find or hard to DO. And by do, I mean it
goes against everything your behavioral instincts tell you to do.
Buying a stock at all time highs is hard to do, and one reason momentum
and trend work. Buying a value investment is hard for many reasons, a
few of which I outline below with a very relevant current example,
Russian stocks.
1. All of the headlines are negative.
2. The investment has declined, usually by A LOT.
3. All of the trailing fundamentals are really bad.
4. People can find many reasons why “this time is different” for the value metrics not to be reflective of the current situation.
5. There is a non-zero risk of the investment going to zero.
6. It is not popular (or patriotic) to own the investment.
7. Buying the investment, and it going down more, would pose serious career risk. (or divorce risk).
8. The banking consensus is all sell rated.
9. Flows are out.
Russia checks all of these boxes and then some.
For the same reason we recommend to never put all your eggs in one basket with a single stock, the same goes for countries too. If you plan on value investing with countries it makes sense to buy a basket rather than just one or two. As was the case with Greece going to a CAPE of 2 in 2012, Russia could easily get cut in half again. But secular bears set the stage for secular bulls, and vice versa. Off to pizza in Phoenix.
- See more at: http://mebfaber.com/2014/03/26/why-value-investing-is-so-hard-russian-edition/#sthash.kzcijsje.dpuf
1. All of the headlines are negative.
2. The investment has declined, usually by A LOT.
3. All of the trailing fundamentals are really bad.
4. People can find many reasons why “this time is different” for the value metrics not to be reflective of the current situation.
5. There is a non-zero risk of the investment going to zero.
6. It is not popular (or patriotic) to own the investment.
7. Buying the investment, and it going down more, would pose serious career risk. (or divorce risk).
8. The banking consensus is all sell rated.
9. Flows are out.
Russia checks all of these boxes and then some.
For the same reason we recommend to never put all your eggs in one basket with a single stock, the same goes for countries too. If you plan on value investing with countries it makes sense to buy a basket rather than just one or two. As was the case with Greece going to a CAPE of 2 in 2012, Russia could easily get cut in half again. But secular bears set the stage for secular bulls, and vice versa. Off to pizza in Phoenix.
- See more at: http://mebfaber.com/2014/03/26/why-value-investing-is-so-hard-russian-edition/#sthash.kzcijsje.dpuf
Many
times on this blog I’ve mentioned that for every investing strategy
there needs to be a fundamental reason why it works. A basic, “explain
to your 12 year old niece reason why it works”. Value investing, at its
most basic, is buying $1 for $.80 (or less than intrinsic value). Most
of the alpha out there (or smart beta or whatever it is being called
these days) is either hard to find or hard to DO. And by do, I mean it
goes against everything your behavioral instincts tell you to do.
Buying a stock at all time highs is hard to do, and one reason momentum
and trend work. Buying a value investment is hard for many reasons, a
few of which I outline below with a very relevant current example,
Russian stocks.
1. All of the headlines are negative.
2. The investment has declined, usually by A LOT.
3. All of the trailing fundamentals are really bad.
4. People can find many reasons why “this time is different” for the value metrics not to be reflective of the current situation.
5. There is a non-zero risk of the investment going to zero.
6. It is not popular (or patriotic) to own the investment.
7. Buying the investment, and it going down more, would pose serious career risk. (or divorce risk).
8. The banking consensus is all sell rated.
9. Flows are out.
Russia checks all of these boxes and then some.
For the same reason we recommend to never put all your eggs in one basket with a single stock, the same goes for countries too. If you plan on value investing with countries it makes sense to buy a basket rather than just one or two. As was the case with Greece going to a CAPE of 2 in 2012, Russia could easily get cut in half again. But secular bears set the stage for secular bulls, and vice versa. Off to pizza in Phoenix.
- See more at: http://mebfaber.com/2014/03/26/why-value-investing-is-so-hard-russian-edition/#sthash.KNudARx9.dpuf
1. All of the headlines are negative.
2. The investment has declined, usually by A LOT.
3. All of the trailing fundamentals are really bad.
4. People can find many reasons why “this time is different” for the value metrics not to be reflective of the current situation.
5. There is a non-zero risk of the investment going to zero.
6. It is not popular (or patriotic) to own the investment.
7. Buying the investment, and it going down more, would pose serious career risk. (or divorce risk).
8. The banking consensus is all sell rated.
9. Flows are out.
Russia checks all of these boxes and then some.
For the same reason we recommend to never put all your eggs in one basket with a single stock, the same goes for countries too. If you plan on value investing with countries it makes sense to buy a basket rather than just one or two. As was the case with Greece going to a CAPE of 2 in 2012, Russia could easily get cut in half again. But secular bears set the stage for secular bulls, and vice versa. Off to pizza in Phoenix.
- See more at: http://mebfaber.com/2014/03/26/why-value-investing-is-so-hard-russian-edition/#sthash.KNudARx9.dpuf
Many
times on this blog I’ve mentioned that for every investing strategy
there needs to be a fundamental reason why it works. A basic, “explain
to your 12 year old niece reason why it works”. Value investing, at its
most basic, is buying $1 for $.80 (or less than intrinsic value). Most
of the alpha out there (or smart beta or whatever it is being called
these days) is either hard to find or hard to DO. And by do, I mean it
goes against everything your behavioral instincts tell you to do.
Buying a stock at all time highs is hard to do, and one reason momentum
and trend work. Buying a value investment is hard for many reasons, a
few of which I outline below with a very relevant current example,
Russian stocks.
1. All of the headlines are negative.
2. The investment has declined, usually by A LOT.
3. All of the trailing fundamentals are really bad.
4. People can find many reasons why “this time is different” for the value metrics not to be reflective of the current situation.
5. There is a non-zero risk of the investment going to zero.
6. It is not popular (or patriotic) to own the investment.
7. Buying the investment, and it going down more, would pose serious career risk. (or divorce risk).
8. The banking consensus is all sell rated.
9. Flows are out.
Russia checks all of these boxes and then some.
For the same reason we recommend to never put all your eggs in one basket with a single stock, the same goes for countries too. If you plan on value investing with countries it makes sense to buy a basket rather than just one or two. As was the case with Greece going to a CAPE of 2 in 2012, Russia could easily get cut in half again. But secular bears set the stage for secular bulls, and vice versa. Off to pizza in Phoenix.
- See more at: http://mebfaber.com/2014/03/26/why-value-investing-is-so-hard-russian-edition/#sthash.KNudARx9.dpuf
1. All of the headlines are negative.
2. The investment has declined, usually by A LOT.
3. All of the trailing fundamentals are really bad.
4. People can find many reasons why “this time is different” for the value metrics not to be reflective of the current situation.
5. There is a non-zero risk of the investment going to zero.
6. It is not popular (or patriotic) to own the investment.
7. Buying the investment, and it going down more, would pose serious career risk. (or divorce risk).
8. The banking consensus is all sell rated.
9. Flows are out.
Russia checks all of these boxes and then some.
For the same reason we recommend to never put all your eggs in one basket with a single stock, the same goes for countries too. If you plan on value investing with countries it makes sense to buy a basket rather than just one or two. As was the case with Greece going to a CAPE of 2 in 2012, Russia could easily get cut in half again. But secular bears set the stage for secular bulls, and vice versa. Off to pizza in Phoenix.
- See more at: http://mebfaber.com/2014/03/26/why-value-investing-is-so-hard-russian-edition/#sthash.KNudARx9.dpuf
Morgan Stanley: gold price won't see $1,300 again
http://www.mining.com/morgan-stanley-gold-price-wont-see-1300-again-92623/?utm_source=twitterfeed&utm_medium=twitter
The gold price on Tuesday continued to hover below the $1,300 an ounce level, down more than $80 an ounce from 2014 highs reached mid-March.
US investment bank Morgan Stanley added to the negative sentiment, forecasting the gold price to average $1,250 this quarter, decline to an average $1,168 in the second half of 2014 and weaken further to $1,138 next year.
The commodity analysts at Morgan Stanley are quoted in Barron's blog that record demand from China "won't be enough to keep gold’s price above $1,200 per ounce in the coming year, much less help it rise".
The bank blames a slide in the value of the Chinese currency, the yuan, against the US dollar for weakening demand.
Signs of a drop-off in the world's top importer of gold are already visible:
Mainland China's net imports totaled 80.6 tonnes in March, a 27% drop compared to the 111.4 tonnes imported in February.
Compared to the same time last year the drop-off was even more stark – down 38% from the record 130 tonnes in March 2013.
Another indication that there are fewer buyers in China is the disappearance of premiums paid on the Shanghai Gold Exchange.
From premiums that topped out at $37 when gold was trading around $1,200 last year, during March traders on average offered gold at a small discount to the quoted London spot price.
March was the first month since September 2012 that gold did not attract a premium.
Driven in part by a weakening yuan, discounts on gold widened to as much as $9 an ounce below when the price were headed towards $1,400 in March.
Apart from Asian demand issues, factors that have helped gold gain some 8% in value this year compared to a 28% fall in 2013 will also be fading in importance over the course of 2014.
Morgan Stanley argues geopolitical tensions and worries about the US and Chinese economy won't attract safe-haven buying of gold like it did early this year.
And tepid interest from futures traders and ETF investors will see the metal drift lower this year and next.
The gold price on Tuesday continued to hover below the $1,300 an ounce level, down more than $80 an ounce from 2014 highs reached mid-March.
US investment bank Morgan Stanley added to the negative sentiment, forecasting the gold price to average $1,250 this quarter, decline to an average $1,168 in the second half of 2014 and weaken further to $1,138 next year.
The commodity analysts at Morgan Stanley are quoted in Barron's blog that record demand from China "won't be enough to keep gold’s price above $1,200 per ounce in the coming year, much less help it rise".
The bank blames a slide in the value of the Chinese currency, the yuan, against the US dollar for weakening demand.
Signs of a drop-off in the world's top importer of gold are already visible:
Mainland China's net imports totaled 80.6 tonnes in March, a 27% drop compared to the 111.4 tonnes imported in February.
Compared to the same time last year the drop-off was even more stark – down 38% from the record 130 tonnes in March 2013.
Another indication that there are fewer buyers in China is the disappearance of premiums paid on the Shanghai Gold Exchange.
From premiums that topped out at $37 when gold was trading around $1,200 last year, during March traders on average offered gold at a small discount to the quoted London spot price.
Geopolitical tensions and worries about the US economy won't attract safe-haven buying like it did earlier in 2014
March was the first month since September 2012 that gold did not attract a premium.
Driven in part by a weakening yuan, discounts on gold widened to as much as $9 an ounce below when the price were headed towards $1,400 in March.
Apart from Asian demand issues, factors that have helped gold gain some 8% in value this year compared to a 28% fall in 2013 will also be fading in importance over the course of 2014.
Morgan Stanley argues geopolitical tensions and worries about the US and Chinese economy won't attract safe-haven buying of gold like it did early this year.
And tepid interest from futures traders and ETF investors will see the metal drift lower this year and next.
Subscribe to:
Posts (Atom)
At the Economic Club of New York, New York, New York
October 15, 2007
The Recent Financial Turmoil and its Economic and Policy Consequences
http://www.federalreserve.gov/newsevents/speech/bernanke20071015a.htm
It does seem that, together with our earlier actions to enhance liquidity, the September policy action has served to reduce some of the pressure in financial markets, although considerable strains remain. From the perspective of the near-term economic outlook, the improved functioning of financial markets is a positive development in that it increases the likelihood of achieving moderate growth with price stability.
However, in such situations, one must also take seriously the possibility that policy actions that have the effect of reducing stress in financial markets may also promote excessive risk-taking and thus increase the probability of future crises. As I indicated in earlier remarks, it is not the responsibility of the Federal Reserve–nor would it be appropriate–to protect lenders and investors from the consequences of their financial decisions. But developments in financial markets can have broad economic effects felt by many outside the markets, and the Federal Reserve must take those effects into account when determining policy. In particular, as I have emphasized, the Federal Reserve has a mandate from the Congress to promote maximum employment and stable prices, and its monetary policy actions will be chosen so as to best meet that mandate.