There are a large number of public and private services that measure the change in home prices.
The
algorithms behind these services, while complex, are primarily based on
recent sale prices for comparative homes and adjusted for factors like
location, property characteristics and the particulars of the house.
While
these pricing services are considered to be well represented measures
of house prices, there is another important factor that is frequently
overlooked despite the large role in plays in house prices.
In August 2016, the 30-year fixed mortgage rate as reported by the Federal Reserve hit an all-time low of 3.44%.
Since then it has risen to its current level of 4.50%.
While
a 1% increase may appear small, especially at this low level of rates,
the rise has begun to adversely affect housing and mortgage activity.
After rising 33% and 22% in 2015 and 2016 respectively, total mortgage
originations were down -16% in 2017. Further increases in rates will
likely begin to weigh on house prices and the broader economy. This
article will help quantify the benefit that lower rates played in making
houses more affordable over the past few decades. By doing this, we can
appreciate how further increases in mortgage rates might adversely
affect house prices.
Lower Rates
In
1981 mortgage rates peaked at 18.50%. Since that time they have
declined steadily and now stands at a relatively paltry 4.50%. Over this
37-year period, individuals’ payments on mortgage loans also declined
allowing buyers to get more for their money. Continually declining rates
also allowed them to further reduce their payments through refinancing.
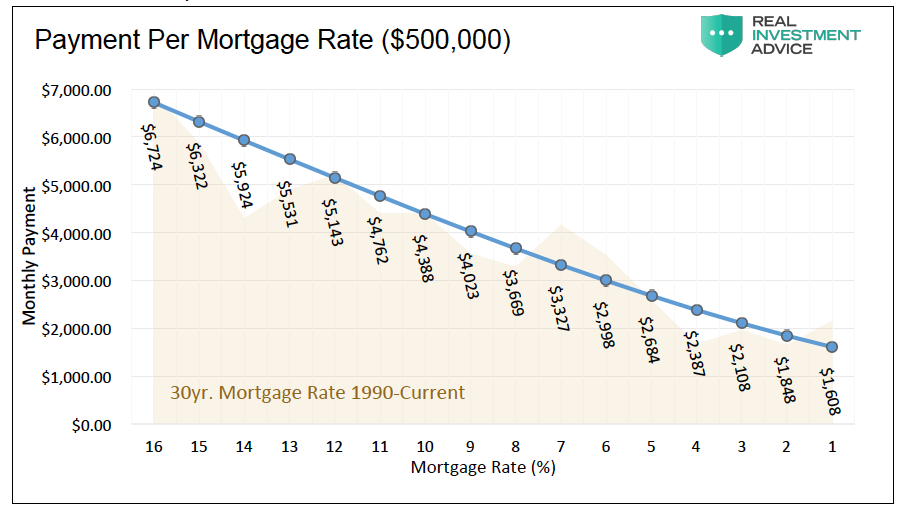
Consider that in 1990 a $500,000 house, bought with a 10%, 30-year
fixed rate mortgage, which was the going rate, would have required a
monthly principal and interest payment of $4,388. Today a loan for the
same amount at the 4.50% current rate is almost half the payment at
$2,533.
The sensitivity of mortgage payments to changes in
mortgage rates is about 9%, meaning that each 1% increase or decrease in
the mortgage rate results in a payment increase or decrease of 9%. From
a home buyer’s perspective, this means that each 1% change in rates
makes the house more or less affordable by about 9%.
Given this
understanding of the math and the prior history of rate declines, we can
calculate how lower rates helped make housing more affordable. To do
this, we start in the year 1990 with a $500,000 home price and adjust it
annually based on changes in the popular Case-Shiller House Price
Index. This calculation approximates the 28-year price appreciation of
the house. Second, we further adjust it to the change in interest rates.
To accomplish this, we calculated how much more or less home one could
buy based on the change in interest rates. The difference between the
two, as shown below, provides a value on how much lower interest rates
benefited home buyers and sellers.
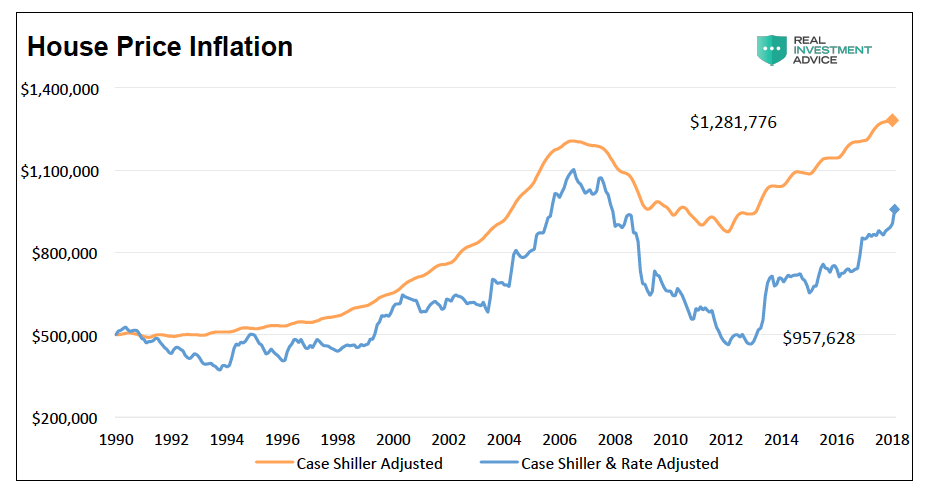
The
graph shows that lower payments resulting from the decline in mortgage
rates benefited buyers by approximately $325,000. Said differently, a
homeowner can afford $325,000 more than would have otherwise been
possible due to declining rates.
The Effect of Rising Rates
As
stated, mortgage rates have been steadily declining for the past 37
years. There are some interest rate forecasters that believe the recent
uptick in rates may be the first wave of a longer-term change in trend.
If this is, in fact, the case, quantifying how higher mortgage rates
affect payments, supply, demand, and therefore the prices of houses is
an important consideration for the direction of the broad economy.
The
graph below shows the mortgage payment required for a $500,000 house
based on a range of mortgage rates. The background shows the decline in
mortgage rates (10.00% to 4.50%) from 1990 to today.
To
put this into a different perspective, the following graph shows how
much a buyer can afford to pay for a house assuming a fixed payment
($2,333) and varying mortgage rates. The payment is based on the current
mortgage rate.
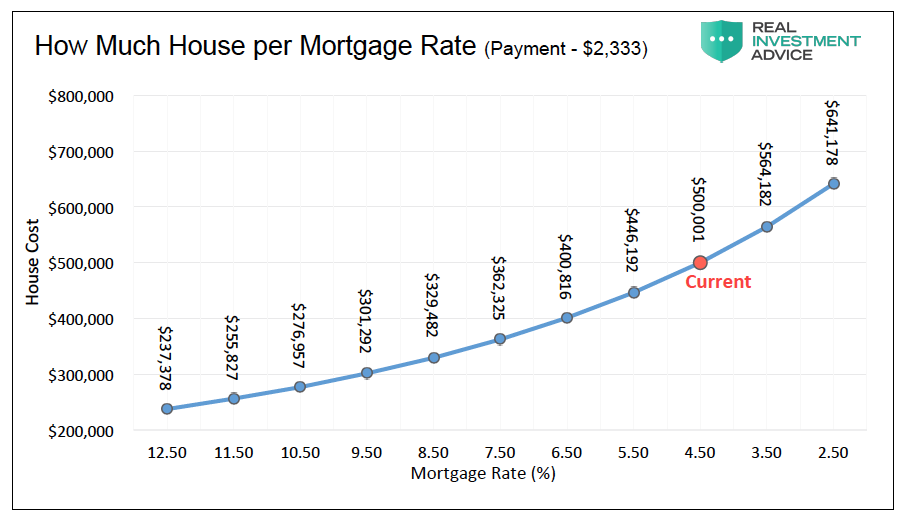
As
the graphs portray, home buyers will be forced to make higher mortgage
payments or seek lower-priced houses if rates keep rising.
Summary
The
Fed has raised interest rates six times since the end of 2015. Their
forward guidance from recent Federal Open Market Committee (FOMC)
meeting statements and minutes tells of their plans on continuing to do
so throughout this year and next. Additionally, the Fed owns over
one-quarter of all residential mortgage-backed securities (MBS) through
QE purchases. Their stated plan is to
reducetheir ownership of
those securities over the next several quarters. If the Fed continues on
their expected path with regard to rates and balance sheet, it creates a
significant market adjustment in terms of supply and demand dynamics
and further implies that mortgage rates should rise.
The
consequences of higher mortgage rates will not only affect buyers and
sellers of housing but also make borrowing on the equity in homes more
expensive. From a macro perspective, consider that housing contributes
15-18% to GDP, according to the National Association of Home Builders
(NAHB). While we do not expect higher rates to devastate the housing
market, we do think a period of price declines and economic weakness
could accompany higher rates.
This analysis is clinical using
simple math to illustrate the relationship, cause, and effects, between
changes in interest rates and home prices. However, the housing market
is anything but a simple asset class. It is among the most complex of
systems within the broad economy. Rising rates not only impact
affordability but also the general level of activity which feeds back
into the economy. In addition to the effect that rates may have, also
consider that the demographics for housing are challenged as retiring,
empty-nest baby boomers seek to downsize. To whom will they sell and at
what price?
If interest rates do indeed continue to rise, there is
a lot more risk embedded in the housing market than currently seems
apparent as these and other dynamics converge. The services providing
pricing insight into the value of the housing market may do a fine job
of assessing current value, but they lack the sophistication required to
see around the next economic corner.
Twitter: @michaellebowitz

