Thursday, January 26, 2017

Warren Buffett's Cash Problem

Warren Buffett's Cash Problem


Summary

In this article I decided to dig into the question regarding Berkshire Hathaway's cash and what it means for the firm.
As opposed to sticking solely with the $20 billion benchmark so often thrown out there, I looked at how cash stacks up against other metrics.
For the most part, even by historically-elevated standards, cash still looks to be too high and this likely means some sort of action will take place in the near future.
Most likely this will result in an acquisition but while it's impossible to know which company it might be, I have my own pick that I'd love to see completed.
One company that is hard for investors to not keep a close eye on is Berkshire Hathaway (NYSE:BRK.A) (NYSE:BRK.B). Not only is the firm the financial/investment embodiment of Warren Buffett's value investing philosophy, it's also one of the largest publicly traded companies on the face of the planet with a market cap, as of the time of this writing, of $408.74 billion. By every measure, Berkshire is a behemoth.

I should say that, given the company's strong financial performance since Buffett took over decades ago and the philosophy that guides it, I believe the business may be one of the best long-term prospects for investors out there (for those looking for "safer" and steady returns) and if I were planning on buying any company knowing that I'd be heading into a 20-year coma the next day, Berkshire would probably take a very close second place for me right behind The Walt Disney Company (NYSE:DIS). That said, while looking over the firm's financials again, I noticed something that warrants some discussion: Buffett's large cash position.

A look at Berkshire's cash
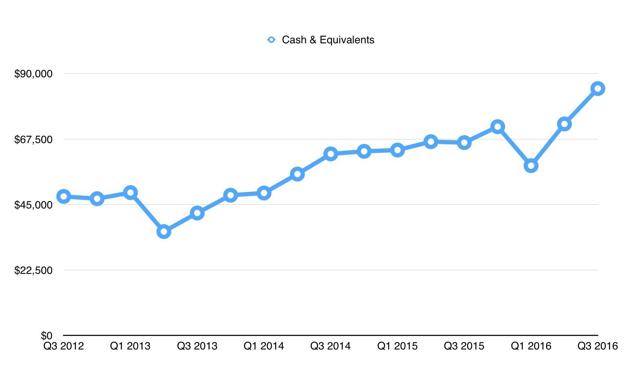
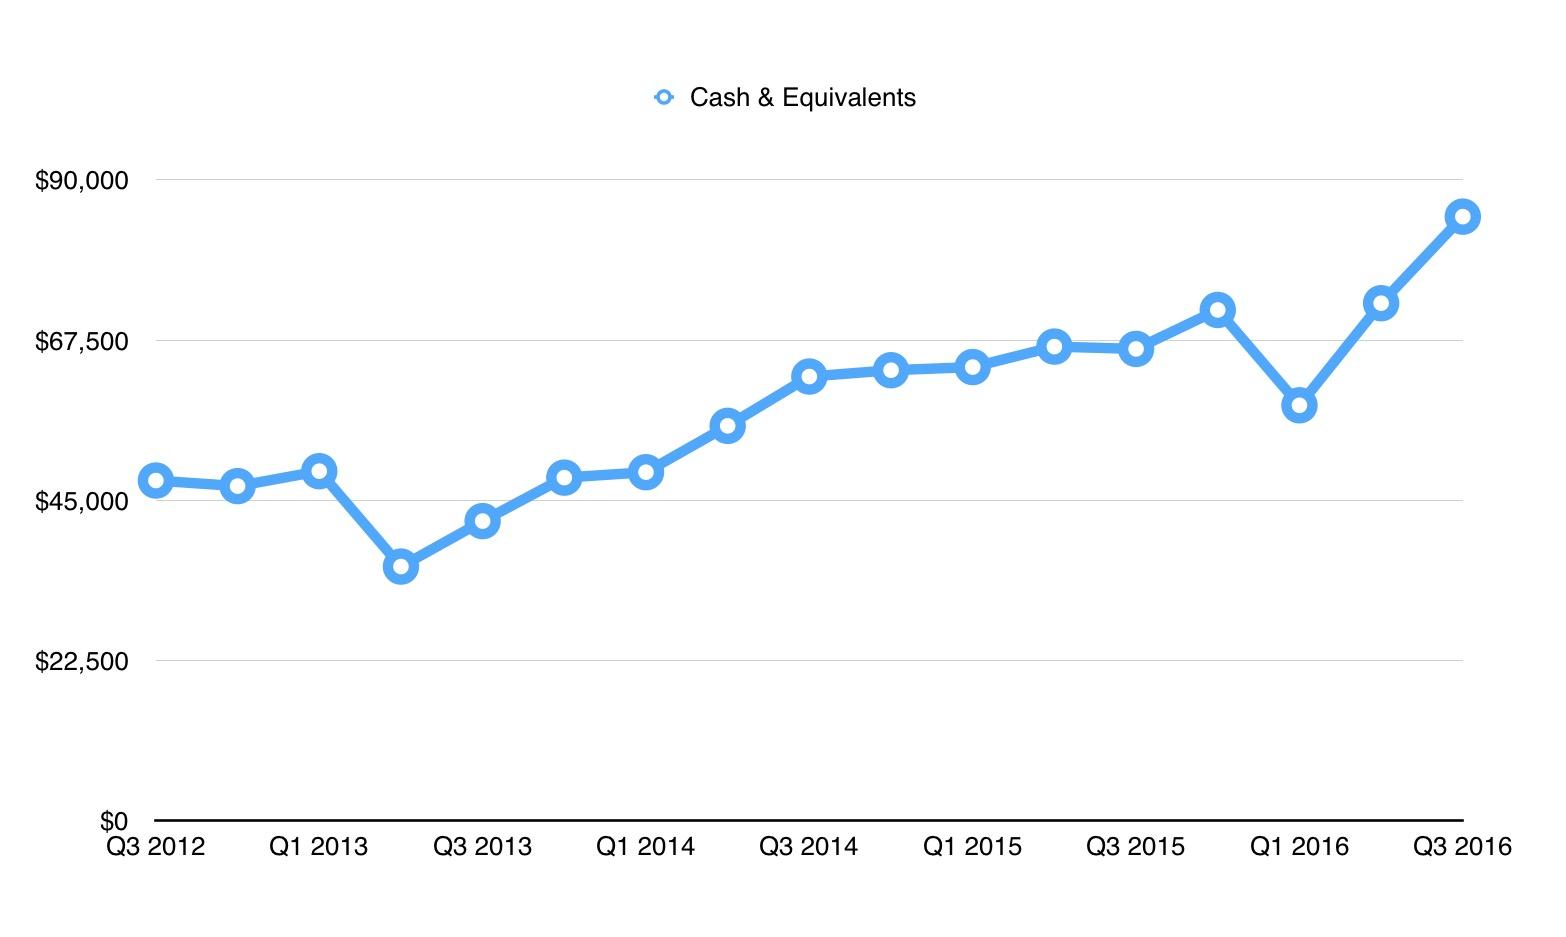
The saying that cash is king has a ring of truth to it but there are limits to how much cash a person or company should hold. You see, while cash is great to have in the event a major market downturn comes along, keeping it on your balance sheet also means that you're missing out on attractive opportunities. In the past, Buffett has said he generally likes to have around $20 billion in cash on hand but today, as you can see in the graph below, he has far more than that.

*Created by Author
The graph in question shows that, as of the end of Berkshire's third quarter, the company has cash and cash equivalents on hand totaling $84.84 billion, the largest the company has ever posted. In fact, the closest we have seen to this came in the second quarter of this year when cash came out to $72.68 billion (a difference of $12.16 billion!). However, the question becomes whether or not the cash is truly too much.
http://seekingalpha.com/article/4033082-gauging-warren-buffetts-cash-problem
You see, while Buffett aims to hold cash of around $20 billion and would like to deploy the rest in order to grow Berkshire or, when appropriate, buy back stock, we also need to keep in mind that a company's needs change. Take, for instance, a firm that doubles in size over a few years. If $20 billion was a sweet spot for said firm before it doubled, then its increased operations should mean that some amount around $40 billion is now appropriate (maybe a little less or a little more). In essence, we're dealing with a dynamic system here, not a static one where a fixed dollar amount should be the ideal in perpetuity.

*Created by Author
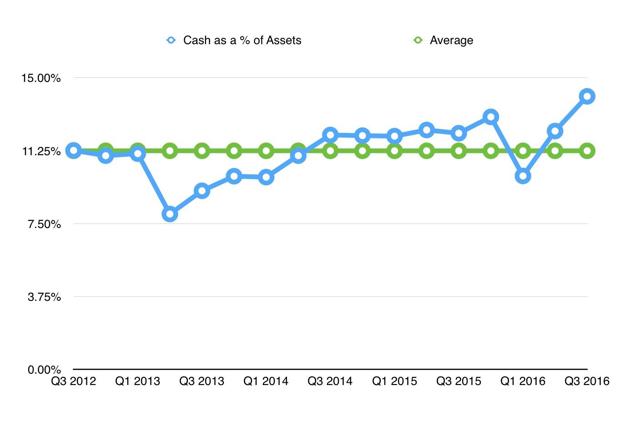
So, to move away from the fixed dollar amount argument that other Buffett cash articles have made, I decided to look at cash relative to the company as a whole. One such example can be seen in the graph above, which compares Berkshire's cash to its assets as a whole over the past five years (using quarterly data). What you can see here is that, in addition to cash rising as a whole since the third quarter of 2012, it has also risen as a percent of assets, climbing from its five-year average of 11.24% to 14.04%.

*Created by Author
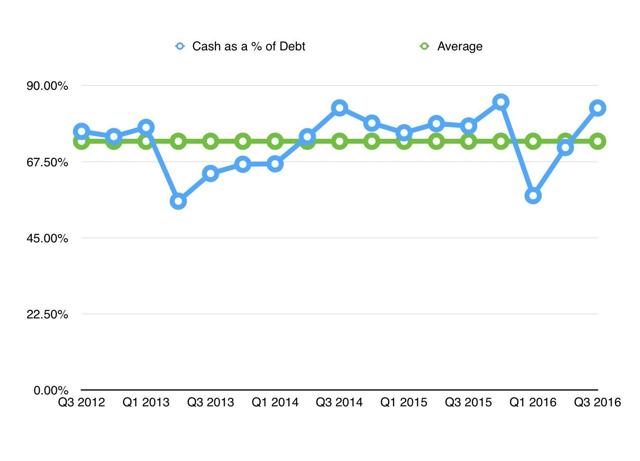
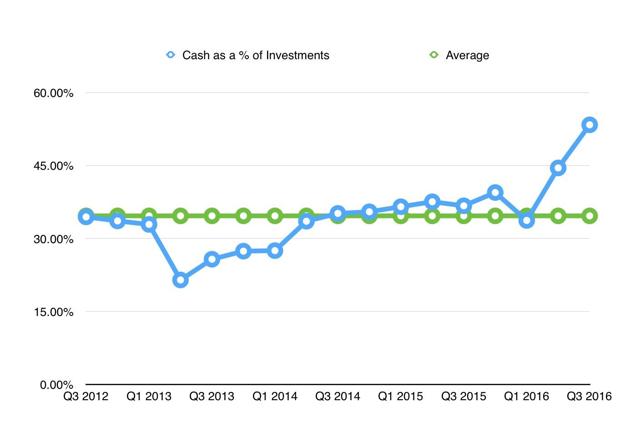
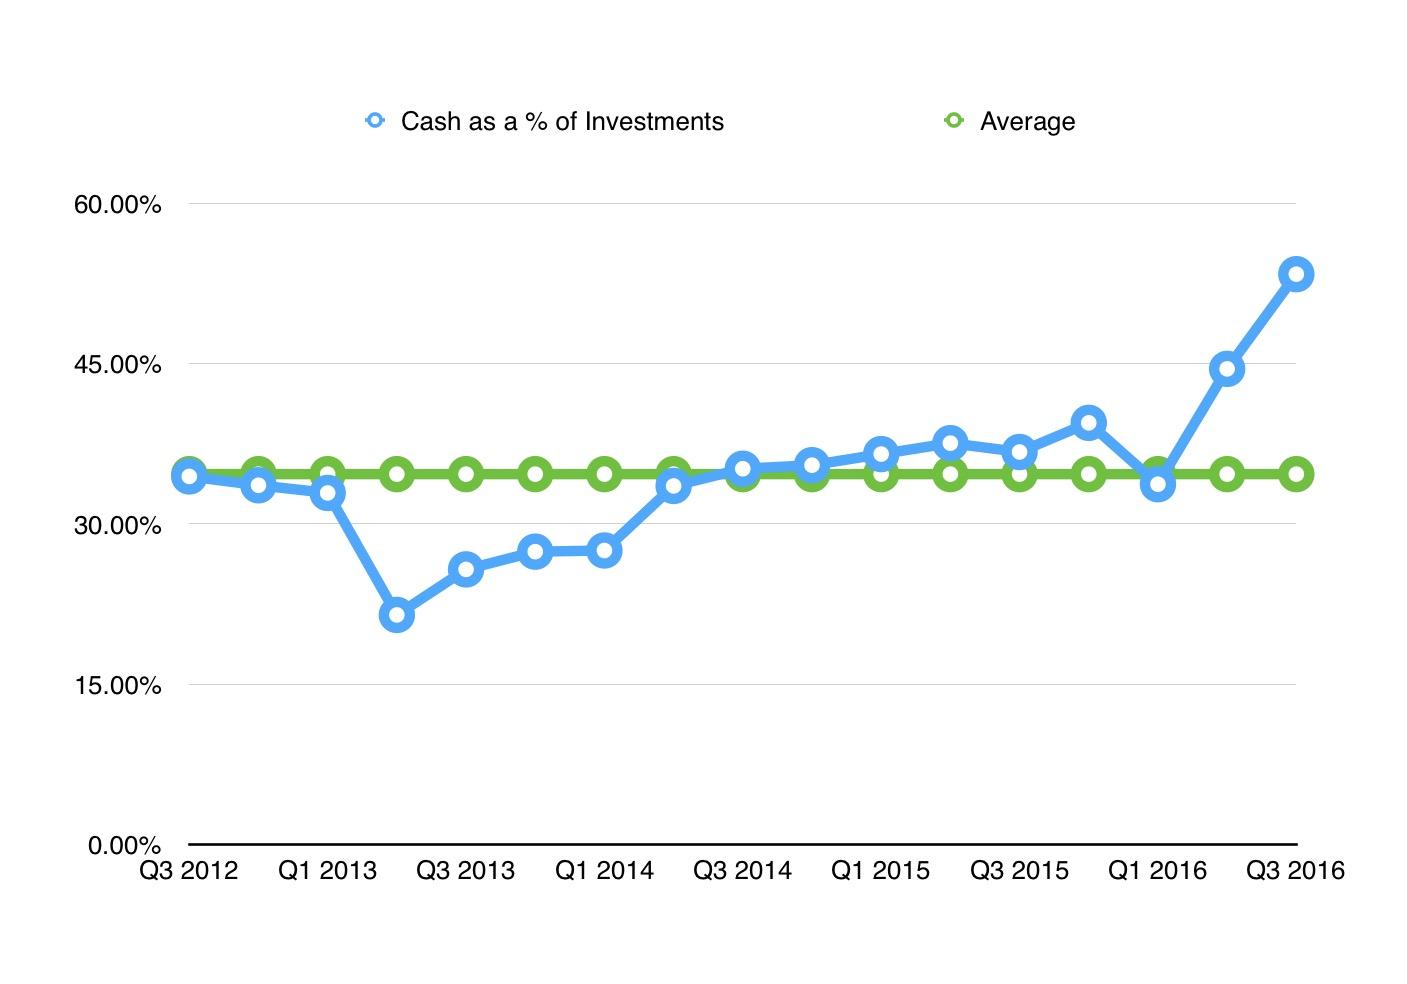
Beyond just assets, however, I decided to look into cash as a percent of debt and cash as a percent of investments, pictured above and below, respectively. The reason here is that, due to the nature of assets and the nature of companies adopting leverage, we need to be cognizant of areas where anomalies could develop. Take, for instance, a scenario where Berkshire might drastically increase its cash but it also saw a massive uptick in debt. Well, that just means the company is borrowing now for the sake of financial flexbility, which means "excess cash" is an operational and accounting convention that must be reconciled.

*Created by Author
Changes in investments could also have implications here since when investments are sold (and in Berkshire's case, a lot of its investments can be sold quickly if need be), the end result, without any offsetting scenario where cash is sent out of the company once again, is more cash. A very good example regarding Berkshire came during the second quarter. Previously, the firm held onto preferred shares of Kraft-Heinz (NASDAQ:KHC) that paid the company a 9% dividend each year. On June 7th of this year, Kraft-Heinz decided to redeem these shares, which was instrumental in reducing Berkshire's investments from $163.25 billion to $158.91 billion over the course of a quarter and transferred to Berkshire cash of $8.32 billion. This is why, in the graph above, the departure of Berkshire from close to its average cash as a percent of investments was so volatile.
What to do?
If we look at Berkshire's cash position over the past few years, we can arrive at the conclusion that not only does the firm seem to have a large amount of cash relative to the $20 billion benchmark but, even by historical norms compared to already elevated levels, its cash position is abnormally large (though by the percent of debt method, this appears to not be the case all that much). This begs the question of what, in Buffett's mind, is next.
You see, Buffett is not the kind of investor who will solve the problem the way Apple (NASDAQ:AAPL) did when it decided to pay out a distribution. For better or worse (I believe better), Buffett will almost certainly never pay out any dividends to shareholders. This leaves a few different options. First, he could be saving the cash up for a rainy day, a period of time when the markets fall irrationally lower, possibly as a result of an economic downturn. Given his mindset regarding trying to time the market, namely that, "People that think they can predict the short-term movement of the stock market - or listen to other people who talk about (timing the market) - they are making a big mistake".
Share buybacks are also unlikely due to the fact that, in the past, Buffett has been vocal about when he is interested in making sizable moves. Generally speaking, this is when the company is trading around 1.20 times book value or less. Using Berkshire's third quarter book value, we're looking at a threshold of $327.14 billion so, right now, shares would need to fall quite a bit (around 20%) before that becomes reasonable.
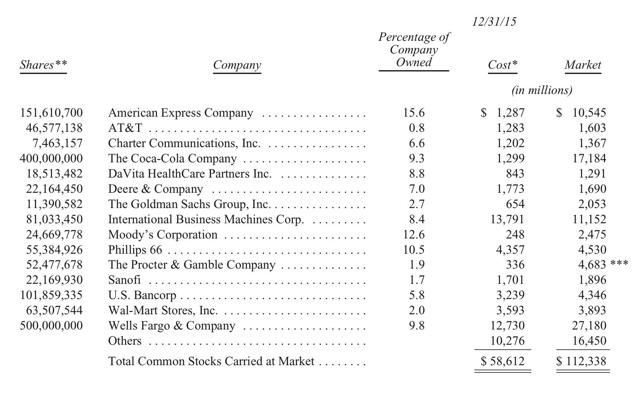
The last option we can look at would be an acquisition of some sort. Last year, the firm bought up all of Precision Castparts, its largest acquisition ever, in an all-cash deal of $32 billion and the company has made a number of other large purchases over the years, such as Burlington Northern Santa Fe and Lubrizol, so seeing something of this nature sometime soon would make sense. It's impossible to know which company it might be but I'd bet my money on a company Berkshire already owns shares in. In the image below, you can see a list of Berkshire's investments as of the end of last year and the percent of the companies the business owns as a result.

*Taken from Berkshire Hathaway
I will not pretend to guess what Buffett's next move might be (if I ever get a psychic vision like that, I'll sell it to the highest bidder) but one interesting idea that pops to my mind is a purchase of The Coca-Cola Company (NYSE:KO). While the share count of Berkshire's other holdings have changed over the past year, the firm continues to hold the same 400 million shares, currently worth $16.64 billion, that it held at the end of 2015, representing nearly 9.3% of the enterprise.
At this moment, Coca-Cola is worth $179.42 billion on the open market so it would cost Buffett $162.78 billion to buy the firm at what it's worth today (what it doesn't already own). Of course, this isn't the end price that would be paid because some premium (likely a hefty one) would need to be applied. That said, even if Buffett paid a $40 billion premium on the company using shares of Berkshire (he doesn't like doing this but given their price right now, combined with the fact that he used this method when acquiring Burlington Northern Santa Fe, it may be an option), bought Coca-Cola using Berkshire's cash plus Coca-Cola's cash (leaving the $20 billion minimum he likes to see), a deal could get done with $72.38 billion in debt which, at 5% interest (most of Berkshire's debt is below 5%), would cost $3.62 billion per year.


Ignoring the tax shield implications here, which would only benefit Berkshire, the math still works well for the company. This is due to the fact that, in the first three quarters of this year alone, Coca-Cola has generated operating cash flow of $6.72 billion. Beyond the cash flow, however, the company's simplicity, strong brand and continued growth potential make it a Buffett-esque play and a large cash cow that Buffett has owned shares in since 1988 (he acquired around 7% of the business by early 1989). It would be a great capstone to Buffett's long and successful career.

Takeaway
Right now, neither I nor anybody else knows for sure what, exactly, Buffett has in mind regarding Berkshire's cash but we can conclude three things: 1) the firm has a lot of excess cash right now, 2) Buffett's not a fan of too much cash, and 3) he likes acquiring companies and this seems to be more reasonable right now than any other alternative. All of this seems to be pointing at another major acquisition (or a series of small ones like the $634 million spread across 29 bolt-ons seen last year) but figuring out when and what is more or less impossible. Personally I would like to see Buffett take a crack at a big player like Coca-Cola or Disney but the important thing is that the catalyst is already in place for him to buy something in the near future.

Disclosure: I/we have no positions in any stocks mentioned, and no plans to initiate any positions within the next 72 hours.
I wrote this article myself, and it expresses my own opinions. I am not receiving compensation for it (other than from Seeking Alpha). I have no business relationship with any company whose stock is mentioned in this article.

Monday, January 23, 2017

The Myth Of The “Passive Indexing” Revolution

https://realinvestmentadvice.com/the-myth-of-the-passive-indexing-revolution/

 
There is little argument that Exchange Traded Funds, more commonly referred to as “ETF’s” have and will continue to change the landscape of investing. As my colleague Cullen Roach penned:
“The rise of low-cost indexing is one of the most transformational trends in modern investing…The rise of low-cost diversified index funds has changed the meaning of an important debate in finance – the active vs passive debate.
Currently, the debate over “Active vs. Passive” is raging as article after article is penned discussing the money flows into ETF’s.
For example, the Wall Street Journal published an article entitled  “The Dying Business of Picking Stocks” stating:
Over the three years ended Aug. 31, investors added nearly $1.3 trillion to passive mutual funds and their brethren—passive exchange-traded funds—while draining more than a quarter trillion from active funds, according to Morningstar Inc.”
CNBC also jumped on the bandwagon with “Peak Passive? Money Is Gushing Out Of Actively Managed Funds.” To wit:
“Investors bailed on actively managed funds in record numbers during 2016, preferring the reliability and low costs of index funds over taking a chance on finding a stock picker who could beat the market.”
It would certainly seem to be the case given the flow of funds over the last couple of years in particular as noted by ICI and shown in the chart below.

The exodus from actively managed mutual funds is occurring for four primary reasons.
  1. Expenses: The management fees on passive funds are extremely low as the funds do not require investment analysis. In fact, an excel spreadsheet with a few lines of macro coding can replace a traditional portfolio manager. The WSJ article found that fees are almost eight times higher for active funds than passive ones (.77% vs. .10%).
  2. Relative Performance: Not surprisingly, in a market that has been fueled by massive Central Bank interventions, passive funds have outperformed actively managed funds. In the aforementioned article, the WSJ found that over the last five years a meager 11.2% of U.S. large-company mutual funds (actively managed) outperformed the Vanguard 500 passive index fund. Of course, this is due to expense difference as noted above.
  3. Technology Shifts: The advancement for algorithmic and computerized trading is leading to a migration of assets into ETF’s which are ideal for computer-driven allocation models.
  4. Media: One of the biggest reasons for the flows from actively managed mutual funds into ETF’s has been the increased press and media attention on ETF’s. As the markets have pushed higher, and the performance and expense differential exposed, the media has berated investors for not being invested regardless of the risk. Therefore, investors have been “psychologically pushed” to buy ETF’s as the “fear of missing out” has accelerated.
Yes, the world of investing has once again changed, and evolved, just as it has throughout history.
  • 1960-70’s it was the “Nifty Fifty”
  • 1980’s was the rise of the mutual fund industry and “portfolio insurance” as financial deregulation spread.
  • 1990’s the evolution of “online trading” brought individuals into the Wall Street “Casino”
  • 2000’s brought about the “real estate” investing boom.
  • 2010’s Fed-driven liquidity boom and technology blend to create the “passive revolution?”
Of course, I probably don’t need to remind how each of those periods ended in 1974, 1987, 2000 and 2007. Importantly, each time was believed to “be different.”
The current rise of indexed based ETF investing, however, is not a sign of “passive” indexing.

The Myth Of Passive

There are many reasons why individuals SHOULD choose to use ETF’s versus either mutual funds OR individual equities.
  • Costs related to the internal operating fees of mutual funds
  • Trading costs for purchasing individual equities
  • Turnover related to managing an individual equity portfolio
  • Volatility risks
  • Asset selection risks
  • Allocation risks, and most importantly;
  • Behavioral and psychological risks.
With ETF’s many of these problems can be avoided entirely or substantially reduced. Today, more than ever, advisors are actively migrating portfolio management to the use of ETF’s for either some, if not all, of the asset allocation equation. However, they are NOT doing it “passively.” 
For example, in our own portfolio management practice, we offer an entirely ETF driven asset allocation model which is actively managed against the variety of “risks” that arise from asset rotation to inflation, interest rate risks, momentum shifts and inter-market analysis.

We also run a model that is a blend between individual equities, individual bonds (which provide principal protection and income) and ETF’s for both asset allocation diversification and hedging.
However, we are not unique within the overall industry of providing lower cost solutions for clients as the industry continues to press annual management fees below 1% and bring a much-needed focus on fiduciary responsibility.
But, this does NOT MEAN investors, or advisors, have opted to be “passive” investors. They have simply changed the instruments by which they are engaging in “active” trading. This can be seen in the changes of flows between equities and bonds as shown below.

As Cullen noted:
“The rise of index funds has turned us all into ‘asset pickers’ instead of stock pickers. The reality is that we are all discretionary decision makers in our portfolios. Even the choice to do nothing is a discretionary decision. Therefore, all indexing approaches aren’t all that ‘passive’. They’re just different forms of active management that have been sold to investors using clever marketing terminology like ‘factor investing’ and ‘smart beta’ in order to differentiate the brands.”
He is correct. “Active” investing is quite alive and well and being facilitated by the variety of online “apps” and platforms which allow for trading ETF’s with the click of a button. A recent email noted an important point about this shift.
“My whole office uses it [the app], and we are always talking about how our investments are performing. It’s created a social element to investing.”
What the email highlights is the “gambler effect.”  When we gamble, and the reason we become addicted to it, is the “winning” causes our brain to release “dopamine.” As humans, that release makes us feel good and the “social element” created from the approval of others, and the competition bred by it, feeds into our addictive natures.

Therein Lies “The Trap”

The idea of “passive” investing is “romantic” in nature. It’s a world where everyone just invests some money, the markets rise 7% annually and everyone one’s a winner. 
Unfortunately, the markets simply don’t function that way.

Just as the initial speculators via online trading learned heading into 2000, or the real estate speculators learned heading into 2008, there is no “guaranteed winner.”
Today, Millennials who watched their parents get decimated twice by the financial markets have unwittingly been lured back into the casino through apps, Robo-advisors, and platforms with the promise of long-term success through “passive approaches” to investing.
Again, the markets simply don’t function that way.
To quote Jesse Felder of the Felder Report:
‘Embracing passive investing is exactly this sort of ‘cover your eyes and buy’ sort of attitude. Would you embrace the very same price-insensitive approach in buying a car? A house? Your groceries? Your clothes? Of course not. We are all very price-sensitive when it comes to these things. So why should investing be any different?'”

While the idea of passive indexing works while all prices are rising, the reverse is also true. The problem is that once prices begin to fall the previously “passive indexer” becomes an “active panic seller.” With the flood of money into “passive index” and “yield funds,” the tables are once again set for a dramatic and damaging ending.
It is only near peaks in extended bull markets that logic is dismissed for the seemingly easiest trend to make money. Today is no different as the chart below shows the odds are stacked against substantial market gains from current levels.

As my partner, Michael Lebowitz, noted in a recent posting:
“Nobody is going to ring a bell at the top of a market, but there are plenty of warped investment strategies and narratives from history that serve the same purpose — remember internet companies with no earnings and sub-prime CDOs to name two.”
Investors need to be cognizant of, and understand why, the chorus of arguments in favor of short-sighted and flawed strategies are so prevalent. The meteoric rise in passive investing is one such “strategy” sending an important and timely warning.
Just remember, everyone is “passive” until the selling begins.

Sunday, January 8, 2017

Trump is meeting with an ex-bank CEO who wants to abolish the Federal Reserve and return to the gold standard

http://www.businessinsider.com/trump-meeting-john-allison-bank-ceo-abolish-the-fed-gold-standard-2016-11

As President-elect's Donald Trump's transition rolls on, more and more attention is being paid to possible selections for a variety of high-ranking positions and meetings that might help decide these appointments.
On Monday, Trump will meet with John Allison, the former CEO of the bank BB&T and of the libertarian think tank the Cato Institute.
There have been reports that Allison is being considered for Treasury secretary.
Trump's has on the campaign trail questioned the future of the Federal Reserve's political independence, but Allison takes that rhetoric a step further. While running the the Cato Institute, Allison wrote a paper in support of abolishing the Fed.
"I would get rid of the Federal Reserve because the volatility in the economy is primarily caused by the Fed," Allison wrote in 2014 for the Cato Journal, a publication of the institute.
Allison said that simply allowing the market to regulate itself would be preferable to the Fed harming the stability of the financial system.
"When the Fed is radically changing the money supply, distorting interest rates, and over-regulating the financial sector, it makes rational economic calculation difficult," Allison wrote. "Markets do form bubbles, but the Fed makes them worse."
Allison also suggested that the government's practice of insuring bank deposits up to $250,000 should be abolished and the US should go back to a banking system backed by "a market standard such as gold."
Allison also argued for higher capital reserves of up to 20% of assets at banks. On the other hand, he also argued that the government should repeal three of the broadest banking regulations.
"We should raise capital standards, but it is even more important to eliminate burdensome regulations — including Dodd-Frank, the Community Reinvestment Act, and Truth in Lending," Allison wrote. "About 25 percent of a bank's personnel cost relates to regulations. Banks cannot pay the regulatory costs and have high capital standards."
This is similar to Trump's desire to roll back regulation — including Dodd-Frank — on financial institutions, though he has since backtracked somewhat.
It is unclear if any of Allison's policy views will ultimately become a part of Trump's plan, but given the unconventional nature of his ideas, the meeting is notable.

Friday, January 6, 2017

Ray Dalio, founder, Bridgewater Associates, explains why the 1930s hold clues to what lies ahead for the economy

Finance

This is not a normal business cycle; monetary policy will be a lot less effective in the future; investment returns will be very low. These have come to be widely held views, but there is little understanding as to why they are true. I have a simple template for looking at how the economic machine works that helps shine some light. It has three parts.
First, there are three main forces that drive all economies: 1) productivity; 2) the short-term debt cycle, or business cycle, running every five to ten years; and 3) the long-term debt cycle, over 50 to 75 years. Most people don’t adequately understand the long-term debt cycle because it comes along so infrequently. But this is the most important force behind what is happening now.
Second, there are three equilibriums that markets gravitate towards: 1) debt growth has to be in line with the income growth that services those debts; 2) economic operating rates and inflation rates can’t be too high or too low for long; and 3) the projected returns of equities have to be above those of bonds, which in turn have to be above those of cash by appropriate risk premiums. Without such risk premiums the transmission mechanisms of capital won’t work and the economy will grind to a halt. In the years ahead, the capital markets’ transmission mechanism will work more poorly than in the past, as interest rates can’t be lowered and risk premiums of other investments are low. Most people have never experienced this before and don’t understand how this will cause low returns, more debt monetisation and a “pushing on a string” situation for monetary policy.
Third, there are two levers that policy-makers can use to bring about these equilibriums: 1) monetary policy, and 2) fiscal policy. With monetary policy becoming relatively impotent, it’s important for these two to be co-ordinated. Yet the current state of political fragmentation around the world makes effective co-ordination hard to imagine.
The long and the short of it
Although circumstances like these have not existed in our lifetimes, they have taken place numerous times in recorded history. During such periods, central banks need to monetise debt, as they have been doing, and conditions become increasingly risky.
What does this template tell us about the future? By and large, productivity growth is slow, business cycles are near their mid-points and long-term debt cycles are approaching the end of their pushing-on-a-string phases. There is only so much one can squeeze out of a long-term debt cycle before monetary policy becomes ineffective, and most countries are approaching that point. Japan is closest, Europe is a step behind it, the United States is a step or two behind Europe and China a few steps behind America.
For most economies, cyclical influences are close to being in equilibrium and debt growth rates are manageable. In contrast to 2007, when my template signalled that we were in a bubble and a debt crisis was ahead, I don’t now see such an abrupt crisis in the immediate future. Instead, I see the beginnings of a longer-term, gradually intensifying financial squeeze. This will be brought about by both income growth and investment returns being low and insufficient to fund large debt-service, pension and health-care liabilities. Monetary and fiscal policies won’t be of much help.
As time passes, how the money flows between asset classes will get more interesting. At current rates of central-bank debt buying, they will soon hit their own constraints, which they will probably have to abandon to continue monetising. That will mean buying riskier assets, which will push prices of these assets higher and future returns lower.
The bond market is risky now and will get more so. Rarely do investors encounter 
a market that is so clearly overvalued and also so close to its clearly defined limits, as there is a limit to how low negative bond yields can go. Bonds will become a very bad deal as ­central banks try to push more money into them, and savers will decide to keep that money elsewhere.
Right now, while a number of riskier assets look like good value compared with bonds and cash, they are not cheap given their risks. They all have low returns with typical volatility, and as people buy them, their reward-to-risk ratio will worsen. This will create a growing risk that savers will seek to escape financial assets and shift to gold and similar non-monetary preserves of wealth, especially as social and political ­tensions intensify.
For those interested in studying analogous periods, I recommend looking at 1935-45, after the 1929-32 stockmarket and economic crashes, and following the great quantitative easings that caused stock prices and economic activity to rebound and led to “pushing on a string” in 1935. That was the last time that the global configuration of fund­amentals was broadly similar to what it is today.http://www.theworldin.com/article/12774/back-future

CARL ICAHN warns of a Global Collapse!

https://www.youtube.com/watch?v=OCWE5chTuOk

Wednesday, January 4, 2017

Mr. Buffett on the Stock Market 1999

http://archive.fortune.com/magazines/fortune/fortune_archive/1999/11/22/269071/index.htm

Mr. Buffett on the Stock Market The most celebrated of investors says stocks can't possibly meet the public's expectations. As for the Internet? He notes how few people got rich from two other transforming industries, auto and aviation.
By Warren Buffett; Carol Loomis 
 
(FORTUNE Magazine) – Warren Buffett, chairman of Berkshire Hathaway, almost never talks publicly about the general level of stock prices--neither in his famed annual report nor at Berkshire's thronged annual meetings nor in the rare speeches he gives. But in the past few months, on four occasions, Buffett did step up to that subject, laying out his opinions, in ways both analytical and creative, about the long-term future for stocks. FORTUNE's Carol Loomis heard the last of those talks, given in September to a group of Buffett's friends (of whom she is one), and also watched a videotape of the first speech, given in July at Allen & Co.'s Sun Valley, Idaho, bash for business leaders. From those extemporaneous talks (the first made with the Dow Jones industrial average at 11,194), Loomis distilled the following account of what Buffett said. Buffett reviewed it and weighed in with some clarifications.

Investors in stocks these days are expecting far too much, and I'm going to explain why. That will inevitably set me to talking about the general stock market, a subject I'm usually unwilling to discuss. But I want to make one thing clear going in: Though I will be talking about the level of the market, I will not be predicting its next moves. At Berkshire we focus almost exclusively on the valuations of individual companies, looking only to a very limited extent at the valuation of the overall market. Even then, valuing the market has nothing to do with where it's going to go next week or next month or next year, a line of thought we never get into. The fact is that markets behave in ways, sometimes for a very long stretch, that are not linked to value. Sooner or later, though, value counts. So what I am going to be saying--assuming it's correct--will have implications for the long-term results to be realized by American stockholders.

Let's start by defining "investing." The definition is simple but often forgotten: Investing is laying out money now to get more money back in the future--more money in real terms, after taking inflation into account.

Now, to get some historical perspective, let's look back at the 34 years before this one--and here we are going to see an almost Biblical kind of symmetry, in the sense of lean years and fat years--to observe what happened in the stock market. Take, to begin with, the first 17 years of the period, from the end of 1964 through 1981. Here's what took place in that interval:

DOW JONES INDUSTRIAL AVERAGE Dec. 31, 1964: 874.12 Dec. 31, 1981: 875.00

Now I'm known as a long-term investor and a patient guy, but that is not my idea of a big move.
And here's a major and very opposite fact: During that same 17 years, the GDP of the U.S.--that is, the business being done in this country--almost quintupled, rising by 370%. Or, if we look at another measure, the sales of the FORTUNE 500 (a changing mix of companies, of course) more than sextupled. And yet the Dow went exactly nowhere.

To understand why that happened, we need first to look at one of the two important variables that affect investment results: interest rates. These act on financial valuations the way gravity acts on matter: The higher the rate, the greater the downward pull. That's because the rates of return that investors need from any kind of investment are directly tied to the risk-free rate that they can earn from government securities. So if the government rate rises, the prices of all other investments must adjust downward, to a level that brings their expected rates of return into line. Conversely, if government interest rates fall, the move pushes the prices of all other investments upward. The basic proposition is this: What an investor should pay today for a dollar to be received tomorrow can only be determined by first looking at the risk-free interest rate.

Consequently, every time the risk-free rate moves by one basis point--by 0.01%--the value of every investment in the country changes. People can see this easily in the case of bonds, whose value is normally affected only by interest rates. In the case of equities or real estate or farms or whatever, other very important variables are almost always at work, and that means the effect of interest rate changes is usually obscured. Nonetheless, the effect--like the invisible pull of gravity--is constantly there.

In the 1964-81 period, there was a tremendous increase in the rates on long-term government bonds, which moved from just over 4% at year-end 1964 to more than 15% by late 1981. That rise in rates had a huge depressing effect on the value of all investments, but the one we noticed, of course, was the price of equities. So there--in that tripling of the gravitational pull of interest rates--lies the major explanation of why tremendous growth in the economy was accompanied by a stock market going nowhere.

Then, in the early 1980s, the situation reversed itself. You will remember Paul Volcker coming in as chairman of the Fed and remember also how unpopular he was. But the heroic things he did--his taking a two-by-four to the economy and breaking the back of inflation--caused the interest rate trend to reverse, with some rather spectacular results. Let's say you put $1 million into the 14% 30-year U.S. bond issued Nov. 16, 1981, and reinvested the coupons. That is, every time you got an interest payment, you used it to buy more of that same bond. At the end of 1998, with long-term governments by then selling at 5%, you would have had $8,181,219 and would have earned an annual return of more than 13%.

That 13% annual return is better than stocks have done in a great many 17-year periods in history--in most 17-year periods, in fact. It was a helluva result, and from none other than a stodgy bond.
The power of interest rates had the effect of pushing up equities as well, though other things that we will get to pushed additionally. And so here's what equities did in that same 17 years: If you'd invested $1 million in the Dow on Nov. 16, 1981, and reinvested all dividends, you'd have had $19,720,112 on Dec. 31, 1998. And your annual return would have been 19%.

The increase in equity values since 1981 beats anything you can find in history. This increase even surpasses what you would have realized if you'd bought stocks in 1932, at their Depression bottom--on its lowest day, July 8, 1932, the Dow closed at 41.22--and held them for 17 years.
The second thing bearing on stock prices during this 17 years was after-tax corporate profits, which this chart [above] displays as a percentage of GDP. In effect, what this chart tells you is what portion of the GDP ended up every year with the shareholders of American business.

The chart, as you will see, starts in 1929. I'm quite fond of 1929, since that's when it all began for me. My dad was a stock salesman at the time, and after the Crash came, in the fall, he was afraid to call anyone--all those people who'd been burned. So he just stayed home in the afternoons. And there wasn't television then. Soooo... I was conceived on or about Nov. 30, 1929 (and born nine months later, on Aug. 30, 1930), and I've forever had a kind of warm feeling about the Crash.
As you can see, corporate profits as a percentage of GDP peaked in 1929, and then they tanked. The left-hand side of the chart, in fact, is filled with aberrations: not only the Depression but also a wartime profits boom--sedated by the excess-profits tax--and another boom after the war. But from 1951 on, the percentage settled down pretty much to a 4% to 6.5% range.

By 1981, though, the trend was headed toward the bottom of that band, and in 1982 profits tumbled to 3.5%. So at that point investors were looking at two strong negatives: Profits were sub-par and interest rates were sky-high.

And as is so typical, investors projected out into the future what they were seeing. That's their unshakable habit: looking into the rear-view mirror instead of through the windshield. What they were observing, looking backward, made them very discouraged about the country. They were projecting high interest rates, they were projecting low profits, and they were therefore valuing the Dow at a level that was the same as 17 years earlier, even though GDP had nearly quintupled.
Now, what happened in the 17 years beginning with 1982? One thing that didn't happen was comparable growth in GDP: In this second 17-year period, GDP less than tripled. But interest rates began their descent, and after the Volcker effect wore off, profits began to climb--not steadily, but nonetheless with real power. You can see the profit trend in the chart, which shows that by the late 1990s, after-tax profits as a percent of GDP were running close to 6%, which is on the upper part of the "normalcy" band. And at the end of 1998, long-term government interest rates had made their way down to that 5%.

These dramatic changes in the two fundamentals that matter most to investors explain much, though not all, of the more than tenfold rise in equity prices--the Dow went from 875 to 9,181-- during this 17-year period. What was at work also, of course, was market psychology. Once a bull market gets under way, and once you reach the point where everybody has made money no matter what system he or she followed, a crowd is attracted into the game that is responding not to interest rates and profits but simply to the fact that it seems a mistake to be out of stocks. In effect, these people superimpose an I-can't-miss-the-party factor on top of the fundamental factors that drive the market. Like Pavlov's dog, these "investors" learn that when the bell rings--in this case, the one that opens the New York Stock Exchange at 9:30 a.m.--they get fed. Through this daily reinforcement, they become convinced that there is a God and that He wants them to get rich.

Today, staring fixedly back at the road they just traveled, most investors have rosy expectations. A Paine Webber and Gallup Organization survey released in July shows that the least experienced investors--those who have invested for less than five years--expect annual returns over the next ten years of 22.6%. Even those who have invested for more than 20 years are expecting 12.9%.
Now, I'd like to argue that we can't come even remotely close to that 12.9%, and make my case by examining the key value-determining factors. Today, if an investor is to achieve juicy profits in the market over ten years or 17 or 20, one or more of three things must happen. I'll delay talking about the last of them for a bit, but here are the first two:

(1) Interest rates must fall further. If government interest rates, now at a level of about 6%, were to fall to 3%, that factor alone would come close to doubling the value of common stocks. Incidentally, if you think interest rates are going to do that--or fall to the 1% that Japan has experienced--you should head for where you can really make a bundle: bond options.

(2) Corporate profitability in relation to GDP must rise. You know, someone once told me that New York has more lawyers than people. I think that's the same fellow who thinks profits will become larger than GDP. When you begin to expect the growth of a component factor to forever outpace that of the aggregate, you get into certain mathematical problems. In my opinion, you have to be wildly optimistic to believe that corporate profits as a percent of GDP can, for any sustained period, hold much above 6%. One thing keeping the percentage down will be competition, which is alive and well. In addition, there's a public-policy point: If corporate investors, in aggregate, are going to eat an ever-growing portion of the American economic pie, some other group will have to settle for a smaller portion. That would justifiably raise political problems--and in my view a major reslicing of the pie just isn't going to happen.

So where do some reasonable assumptions lead us? Let's say that GDP grows at an average 5% a year--3% real growth, which is pretty darn good, plus 2% inflation. If GDP grows at 5%, and you don't have some help from interest rates, the aggregate value of equities is not going to grow a whole lot more. Yes, you can add on a bit of return from dividends. But with stocks selling where they are today, the importance of dividends to total return is way down from what it used to be. Nor can investors expect to score because companies are busy boosting their per-share earnings by buying in their stock. The offset here is that the companies are just about as busy issuing new stock, both through primary offerings and those ever present stock options.

So I come back to my postulation of 5% growth in GDP and remind you that it is a limiting factor in the returns you're going to get: You cannot expect to forever realize a 12% annual increase--much less 22%--in the valuation of American business if its profitability is growing only at 5%. The inescapable fact is that the value of an asset, whatever its character, cannot over the long term grow faster than its earnings do.

Now, maybe you'd like to argue a different case. Fair enough. But give me your assumptions. If you think the American public is going to make 12% a year in stocks, I think you have to say, for example, "Well, that's because I expect GDP to grow at 10% a year, dividends to add two percentage points to returns, and interest rates to stay at a constant level." Or you've got to rearrange these key variables in some other manner. The Tinker Bell approach--clap if you believe--just won't cut it.
Beyond that, you need to remember that future returns are always affected by current valuations and give some thought to what you're getting for your money in the stock market right now. Here are two 1998 figures for the FORTUNE 500. The companies in this universe account for about 75% of the value of all publicly owned American businesses, so when you look at the 500, you're really talking about America Inc.

FORTUNE 500 1998 profits: $334,335,000,000 Market value on March 15, 1999: $9,907,233,000,000

As we focus on those two numbers, we need to be aware that the profits figure has its quirks. Profits in 1998 included one very unusual item--a $16 billion bookkeeping gain that Ford reported from its spinoff of Associates--and profits also included, as they always do in the 500, the earnings of a few mutual companies, such as State Farm, that do not have a market value. Additionally, one major corporate expense, stock-option compensation costs, is not deducted from profits. On the other hand, the profits figure has been reduced in some cases by write-offs that probably didn't reflect economic reality and could just as well be added back in. But leaving aside these qualifications, investors were saying on March 15 this year that they would pay a hefty $10 trillion for the $334 billion in profits.
Bear in mind--this is a critical fact often ignored--that investors as a whole cannot get anything out of their businesses except what the businesses earn. Sure, you and I can sell each other stocks at higher and higher prices. Let's say the FORTUNE 500 was just one business and that the people in this room each owned a piece of it. In that case, we could sit here and sell each other pieces at ever-ascending prices. You personally might outsmart the next fellow by buying low and selling high. But no money would leave the game when that happened: You'd simply take out what he put in. Meanwhile, the experience of the group wouldn't have been affected a whit, because its fate would still be tied to profits. The absolute most that the owners of a business, in aggregate, can get out of it in the end--between now and Judgment Day--is what that business earns over time.

And there's still another major qualification to be considered. If you and I were trading pieces of our business in this room, we could escape transactional costs because there would be no brokers around to take a bite out of every trade we made. But in the real world investors have a habit of wanting to change chairs, or of at least getting advice as to whether they should, and that costs money--big money. The expenses they bear--I call them frictional costs--are for a wide range of items. There's the market maker's spread, and commissions, and sales loads, and 12b-1 fees, and management fees, and custodial fees, and wrap fees, and even subscriptions to financial publications. And don't brush these expenses off as irrelevancies. If you were evaluating a piece of investment real estate, would you not deduct management costs in figuring your return? Yes, of course--and in exactly the same way, stock market investors who are figuring their returns must face up to the frictional costs they bear.
And what do they come to? My estimate is that investors in American stocks pay out well over $100 billion a year--say, $130 billion--to move around on those chairs or to buy advice as to whether they should! Perhaps $100 billion of that relates to the FORTUNE 500. In other words, investors are dissipating almost a third of everything that the FORTUNE 500 is earning for them--that $334 billion in 1998--by handing it over to various types of chair-changing and chair-advisory "helpers." And when that handoff is completed, the investors who own the 500 are reaping less than a $250 billion return on their $10 trillion investment. In my view, that's slim pickings.

Perhaps by now you're mentally quarreling with my estimate that $100 billion flows to those "helpers." How do they charge thee? Let me count the ways. Start with transaction costs, including commissions, the market maker's take, and the spread on underwritten offerings: With double counting stripped out, there will this year be at least 350 billion shares of stock traded in the U.S., and I would estimate that the transaction cost per share for each side--that is, for both the buyer and the seller--will average 6 cents. That adds up to $42 billion.

Move on to the additional costs: hefty charges for little guys who have wrap accounts; management fees for big guys; and, looming very large, a raft of expenses for the holders of domestic equity mutual funds. These funds now have assets of about $3.5 trillion, and you have to conclude that the annual cost of these to their investors--counting management fees, sales loads, 12b-1 fees, general operating costs--runs to at least 1%, or $35 billion.

And none of the damage I've so far described counts the commissions and spreads on options and futures, or the costs borne by holders of variable annuities, or the myriad other charges that the "helpers" manage to think up. In short, $100 billion of frictional costs for the owners of the FORTUNE 500--which is 1% of the 500's market value--looks to me not only highly defensible as an estimate, but quite possibly on the low side.

It also looks like a horrendous cost. I heard once about a cartoon in which a news commentator says, "There was no trading on the New York Stock Exchange today. Everyone was happy with what they owned." Well, if that were really the case, investors would every year keep around $130 billion in their pockets.

Let me summarize what I've been saying about the stock market: I think it's very hard to come up with a persuasive case that equities will over the next 17 years perform anything like--anything like--they've performed in the past 17. If I had to pick the most probable return, from appreciation and dividends combined, that investors in aggregate--repeat, aggregate--would earn in a world of constant interest rates, 2% inflation, and those ever hurtful frictional costs, it would be 6%. If you strip out the inflation component from this nominal return (which you would need to do however inflation fluctuates), that's 4% in real terms. And if 4% is wrong, I believe that the percentage is just as likely to be less as more.

Let me come back to what I said earlier: that there are three things that might allow investors to realize significant profits in the market going forward. The first was that interest rates might fall, and the second was that corporate profits as a percent of GDP might rise dramatically. I get to the third point now: Perhaps you are an optimist who believes that though investors as a whole may slog along, you yourself will be a winner. That thought might be particularly seductive in these early days of the information revolution (which I wholeheartedly believe in). Just pick the obvious winners, your broker will tell you, and ride the wave.

Well, I thought it would be instructive to go back and look at a couple of industries that transformed this country much earlier in this century: automobiles and aviation. Take automobiles first: I have here one page, out of 70 in total, of car and truck manufacturers that have operated in this country. At one time, there was a Berkshire car and an Omaha car. Naturally I noticed those. But there was also a telephone book of others.

All told, there appear to have been at least 2,000 car makes, in an industry that had an incredible impact on people's lives. If you had foreseen in the early days of cars how this industry would develop, you would have said, "Here is the road to riches." So what did we progress to by the 1990s? After corporate carnage that never let up, we came down to three U.S. car companies--themselves no lollapaloozas for investors. So here is an industry that had an enormous impact on America--and also an enormous impact, though not the anticipated one, on investors.

Sometimes, incidentally, it's much easier in these transforming events to figure out the losers. You could have grasped the importance of the auto when it came along but still found it hard to pick companies that would make you money. But there was one obvious decision you could have made back then--it's better sometimes to turn these things upside down--and that was to short horses. Frankly, I'm disappointed that the Buffett family was not short horses through this entire period. And we really had no excuse: Living in Nebraska, we would have found it super-easy to borrow horses and avoid a "short squeeze."

U.S. Horse Population 1900: 21 million 1998: 5 million
The other truly transforming business invention of the first quarter of the century, besides the car, was the airplane--another industry whose plainly brilliant future would have caused investors to salivate. So I went back to check out aircraft manufacturers and found that in the 1919-39 period, there were about 300 companies, only a handful still breathing today. Among the planes made then--we must have been the Silicon Valley of that age--were both the Nebraska and the Omaha, two aircraft that even the most loyal Nebraskan no longer relies upon.

Move on to failures of airlines. Here's a list of 129 airlines that in the past 20 years filed for bankruptcy. Continental was smart enough to make that list twice. As of 1992, in fact--though the picture would have improved since then--the money that had been made since the dawn of aviation by all of this country's airline companies was zero. Absolutely zero.

Sizing all this up, I like to think that if I'd been at Kitty Hawk in 1903 when Orville Wright took off, I would have been farsighted enough, and public-spirited enough--I owed this to future capitalists--to shoot him down. I mean, Karl Marx couldn't have done as much damage to capitalists as Orville did.
I won't dwell on other glamorous businesses that dramatically changed our lives but concurrently failed to deliver rewards to U.S. investors: the manufacture of radios and televisions, for example. But I will draw a lesson from these businesses: The key to investing is not assessing how much an industry is going to affect society, or how much it will grow, but rather determining the competitive advantage of any given company and, above all, the durability of that advantage. The products or services that have wide, sustainable moats around them are the ones that deliver rewards to investors.
This talk of 17-year periods makes me think--incongruously, I admit--of 17-year locusts [pictured below]. What could a current brood of these critters, scheduled to take flight in 2016, expect to encounter? I see them entering a world in which the public is less euphoric about stocks than it is now. Naturally, investors will be feeling disappointment--but only because they started out expecting too much.

Grumpy or not, they will have by then grown considerably wealthier, simply because the American business establishment that they own will have been chugging along, increasing its profits by 3% annually in real terms. Best of all, the rewards from this creation of wealth will have flowed through to Americans in general, who will be enjoying a far higher standard of living than they do today. That wouldn't be a bad world at all--even if it doesn't measure up to what investors got used to in the 17 years just passed.


Tuesday, January 3, 2017

Stock Surge Presents Risks for the Trump Administration By MARK SPITZNAGEL DEC. 15, 2016


Stock Surge Presents Risks for the Trump Administration By MARK SPITZNAGEL DEC. 15, 2016
The “big, fat, ugly bubble” in the stock market that President-elect Donald J. Trump so astutely identified during his campaign now becomes one of the greatest potential liabilities of his presidency.

If that bubble bursts soon, the pain will correctly be understood to be the result of monetary manipulations during the Obama years. But if it persists and the United States economy manages to further postpone its long-overdue recession (following an expansion that was barely that), Mr. Trump’s ostensibly “free-market” policies will unfairly bear the blame when the markets finally do return to reality — perhaps a year or two down the road.

The postelection Trump rally in the stock market is evidence of euphoric optimism about the fiscal stimulus, reduced regulations and lower taxes that are hoped for. And yet we mustn’t forget where we are today, with distorted pricing in virtually all markets and extremely levered public and private balance sheets, all driven by monetary interventionism on a scale never seen before: By most measures, the stock market is as expensive as it has been for a century, save only the giddy late 1990s.

We must also remember what got us to this spot: namely, extreme, collectivist interventionism by the heavy hand of the state. Perhaps never before have we had such a clear case of a controlled experiment in the effects of economic (and especially monetary) interventionism. Problem is, the election of Mr. Trump is adding noise to this otherwise transparent experiment, and is extremely risky for supporters of his policies because he is poised to take office near such a peak in economic distortion.

The challenge, therefore, is for the incoming administration to let the authorities own the initial pain that is sure to come, such as the pain of pulling off the bandages, while letting the later recovery be his — as it should be. Though the Obama administration was able to blame a previous administration’s presumed free-market policies for eight years of lackluster recovery, it will be much harder for Mr. Trump to transfer blame for any economic crisis that occurs on his watch.
There’s something about a government that steps back to let free markets fix themselves that invariably renders it a ripe target for blame. “Couldn’t you have done something?”

After all, if the rally following his surprise election bears Mr. Trump’s name, the danger is that so, too, will the inevitable correction that neither he nor the Fed can stop. What could result — and what we should all fear, specifically — is the political pendulum swinging violently back toward big government and even greater market interventionism.
If Mr. Trump can focus on the long term and encourage asset prices and investments to correct themselves early (to the extent that he even holds such sway over them), perhaps this controlled experiment can remain obvious to everyone. Worthy or not, as the current general for advocates of the free market, he should hope to lose the short-term battle to win the bigger war, to gain positional advantage for the looming contest ahead.

Mark Spitznagel is the founder and chief investment officer of Universa Investments, and is a former senior economic adviser to Senator Rand Paul of Kentucky.

http://www.nytimes.com/2016/12/15/business/dealbook/stock-surge-presents-risks-for-the-trump-administration.html?_r=0